Implementation Guide
FMEA.
Failure Mode and Effects Analysis (FMEA) is a structured method for anticipating how a process can fail, what each failure would cost, and which controls prevent or catch it before the customer does. The scoring workshop is only the starting point. An FMEA earns its keep through revision discipline: it gets reopened after every complaint, escape and process change, and it drives the control plan instead of decorating the audit binder.
What FMEA is, and which kind this page covers
FMEA is systematic anticipation. For each step of a process, a team asks four questions in order: how can this step fail (the failure mode), what would that failure do downstream and at the customer (the effect), what would make it happen (the cause), and what exists today to prevent or catch it (the current controls). Scores for severity, occurrence and detection turn the answers into priorities, and priorities into actions with owners.
There are two main kinds. A design FMEA (DFMEA) asks how the product itself can fail in use, and belongs to product engineering. A process FMEA (PFMEA) asks how manufacturing can produce a defective product even when the design is sound, and belongs to the plant. This page focuses on the PFMEA, because that is where the analysis either connects to what operators actually check or quietly dies.
And dying is the default. The most common FMEA in industry is a spreadsheet scored once during launch, filed for the auditor, and never opened again, including the week a customer complaint arrives that the analysis either missed or predicted. That document is dead paper. The value of an FMEA is not the initial workshop; it is the discipline of returning to it every time reality disagrees with it, and letting it decide what the control plan checks at the process.
Where FMEA sits in the transformation roadmap
On the TeamGuru deployment roadmap, FMEA belongs to the equipment and methods practice in the Improve stage, alongside SMED, TPM and poka-yoke. It is deliberately not a day-one tool. An FMEA pays off where the plant already captures its problems, because problem history feeds honest occurrence scores and exposes the modes the first workshop missed. Root cause and corrective action supplies that history, and the FMEA pays it forward by deciding what the control plan verifies at every station.
- Before Daily Management
- You are here SMED, TPM, FMEA & Poka-Yoke
- In parallel Kaizen
- After Obeya & Management Reviews
When FMEA becomes waste
FMEA has a poor reputation in many plants, and the reputation is earned in three specific ways:
- One engineer writes FMEAs for the whole plant at a desk. The output is hundreds of rows nobody at the process has seen, with occurrence scores guessed instead of remembered. An analysis the team did not build is a document, and documents do not change behavior.
- Scoring debates outlast action discussions. When a team spends twenty minutes arguing whether occurrence is a 5 or a 6 and four minutes on what to do about the top mode, the meeting is optimizing the wrong number.
- Every new product starts from a blank sheet. If a family or baseline FMEA exists for a similar process, start there and analyze the differences. Blank sheets reproduce old omissions and burn the team's patience on rows that were settled years ago.
The remedy for all three is the same: scope small, build with the people who run the process, and spend the hours saved on actions instead of rows.
How to build an FMEA that lives
A living FMEA is built in short sessions, close to the process, by the people who know how it fails, and it leaves each session with actions rather than just scores.
-
Scope one process, and walk it before analyzing it.
Pick one line or process family, walk it station by station, and write down the steps with the requirement each one must meet. One row per function of a station is the right altitude: torque four hydraulic fittings to 25 Nm can fail in ways worth analyzing; pick up the driver cannot.
-
Start from the family FMEA if one exists.
A baseline analysis of a similar process already contains most of the modes, effects and calibrated scores. Copy it, then analyze what is different about this product and this line. The differences are where the new risk hides.
-
Run cross-functional sessions of about 90 minutes per process step.
Process engineer, quality, an operator who runs the station, and maintenance when equipment behavior matters. For each step: how can it fail, what happens downstream and at the customer, what causes it, and which controls exist today. Current controls means current: a control that is planned, informal or usually done is not a control, and listing it anyway corrupts the detection score.
-
Score against written anchors, fast.
Use anchored scales calibrated once for the company (the table below is a starting point) and timebox each row. A one-point disagreement never changes what you do next. The priority band does, so argue about bands, not decimals.
-
Give every top priority an action with an owner and a date, and update the control plan in the same meeting.
The FMEA and the control plan are two views of one decision: which risk we accept, and what we check because of it. Updated in separate meetings by separate people, they disagree within a quarter. Rescore occurrence or detection only after an action is verified at the process, not when it is planned.
-
Name the revision triggers and the document owner.
The FMEA is reopened after every customer complaint in its scope, every internal escape, every process, product or equipment change, and whenever problem solving uncovers a mode it does not contain. One named owner watches the triggers.
Those triggers are not maintenance around the method. They are the method. The first workshop produces a hypothesis about how the process fails; every complaint and every escape is a test result, meaning reality either found a mode the analysis missed or beat a control the analysis trusted. A mature root cause investigation therefore asks, as a standard question: was this mode in the FMEA? The answer updates the analysis one of three ways. The mode was missing: add it. The mode was there with a flattering occurrence score: rescore it and act. The mode was there and the listed control did not catch it: the detection score was fiction, so fix the control, not just the number. Customer-facing cases run as 8D make this loop explicit: discipline D7, prevention, exists precisely to push the lesson into the FMEA and control plan of the affected product and its siblings.
Worked example: three rows of a PFMEA
The extract below covers the fitting-torque station at the 450-person components manufacturer used across this site. The station torques four hydraulic fittings per unit to 25 Nm; at 456 units per day that is roughly 1,800 torque operations, enough volume that any mistake the process allows will eventually happen on someone's shift. Scores use a 1 to 10 convention, anchored in the next section. The numbers are illustrative but internally consistent.
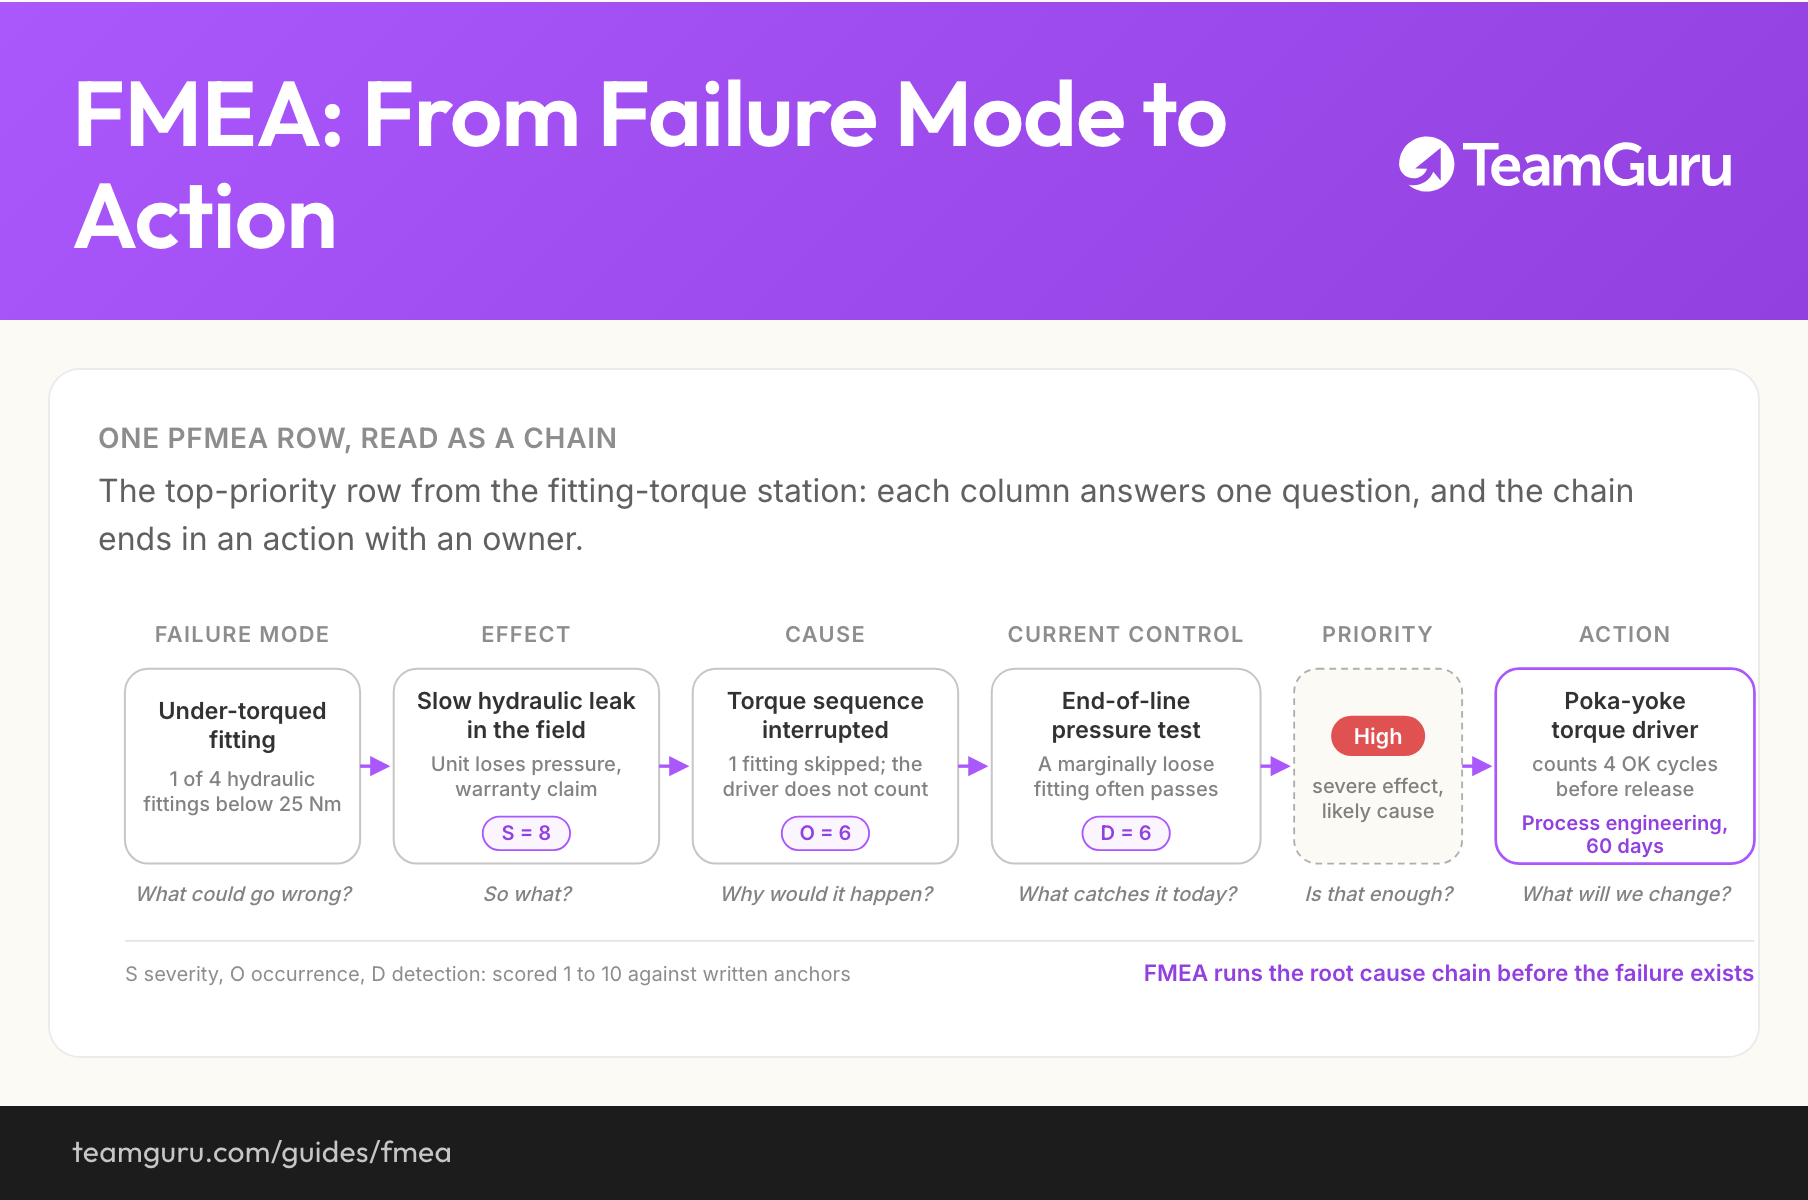
One PFMEA row, read as a chain
The top-priority row from the fitting-torque station: each column answers one question, and the chain ends in an action with an owner.
| Failure mode | Effect (S) | Cause (O) | Current controls (D) | Priority | Recommended action |
|---|---|---|---|---|---|
| Under-torqued fitting | Slow hydraulic leak in the field, unit loses pressure, warranty claim S = 8 | Torque sequence interrupted, one of four fittings skipped; the driver does not count fastenings O = 6 | Torque values in the work instruction; 100 percent end-of-line pressure test, which a marginally under-torqued fitting often passes D = 6 | High | Poka-yoke torque driver with count verification: the station releases the unit only after four OK torque cycles. Owner: process engineering, 60 days. |
| Under-torqued fitting | Slow hydraulic leak in the field, unit loses pressure, warranty claim S = 8 | Driver clutch left on the wrong setting after a changeover between fitting sizes O = 3 | Setup sheet at the station; first-piece torque check with a calibrated wrench D = 5 | Medium | Torque presets selected by work-order barcode scan; monthly torque verification added to the layer 2 audit. Owner: manufacturing engineering, 90 days. |
| Cross-threaded fitting | Immediate leak at the end-of-line pressure test, fitting scrapped and reworked in house S = 6 | Misalignment when the thread is started by hand O = 3 | Hand start to two full turns per standard work; the pressure test catches this mode reliably D = 3 | Low | None. Monitor through the test failure log; revisit if the rework rate trends up. |
Read the three rows as three different outcomes of the same analysis. Row one is the reason the FMEA exists: a severe effect, a cause that lives inside normal daily interruptions, and a detection control that looks stronger than it is. The pressure test runs on every unit, but a marginally under-torqued fitting holds pressure for a 30-second test and starts weeping weeks later under thermal cycling. An honest detection score records what the control actually catches, not the fact that a control exists.
Row two shares the severe effect, but the cause is rarer and partially controlled, so it earns a scheduled action rather than an urgent one. Row three is the row many teams refuse to write: a mode the current controls genuinely handle, priority low, no action. An FMEA that attaches actions to everything prioritizes nothing. The first row's recommended action, replacing human vigilance with a device that counts, is the classic endgame of a high-priority row; the poka-yoke guide covers how to choose and build it.
Scoring severity, occurrence and detection
Severity scores the effect, occurrence scores the cause, and detection scores the current controls' ability to catch the mode before it leaves the plant. All three run 1 to 10 by convention, and none of them means anything until your company writes its own anchors: the same leak is a 4 in one business and a 9 in another. The table below is a starting point for that calibration, with anchors at the bands that matter most.
| Score | Severity of the effect | Occurrence of the cause | Detection by current controls |
|---|---|---|---|
| 9 to 10 | Safety or regulatory effect, possibly without warning | Almost inevitable: seen weekly on this or a near-identical process | No current control, or the control cannot detect this mode |
| 7 to 8 | Loss of primary function: field failure, customer line stops | Frequent: roughly monthly on similar processes | Manual inspection or sampling only |
| 5 to 6 | Degraded performance: in-house rework, scrap, test failures | Occasional: several times a year | Downstream test or gauge catches most occurrences, not all |
| 3 to 4 | Minor annoyance: cosmetic defect, adjustment needed | Rare: seen once or twice in plant memory | Automatic detection at or near the station |
| 1 to 2 | No effect the customer or the next process would notice | Practically eliminated by a prevention control | The error cannot pass: a device blocks or rejects it at the source |
Two honesty rules keep scoring useful. First, calibrate the scales once, with anchors drawn from your own history, and reuse them in every session. Scores that drift with the mood of the room produce the ten-point swings that teach teams to distrust the method. Second, do not let arithmetic outrank judgment. The classic Risk Priority Number multiplied S, O and D, which could rank a severity-9 mode with modest occurrence below a trivial but frequent one; the 2019 AIAG-VDA handbook replaced RPN with Action Priority tables that weight severity first.
You do not need the full tables to get the benefit. This page uses a simple three-band logic, stated once and applied consistently: High when a severe effect (severity 7 or more) pairs with occurrence 4 or more; Medium when a severe effect pairs with lower occurrence but detection of 5 or worse; Low otherwise. Your bands can differ. What matters is that they are written down, that severity weighs heaviest, and that the band, not the debate, decides where the actions go.
Connecting the FMEA to the floor
A control that exists only in a spreadsheet column is fiction. Every prevention control in the FMEA must be findable as a step in standard work, and every detection control must be a real check that a named person performs at a defined frequency. The detection score assumes those checks happen. Layered process audits are how you verify the assumption, by sampling exactly the checks the FMEA counts on. An audit that finds a listed control skipped or unworkable has found a detection score correction, not just an audit finding.
The connection runs in both directions. Downward, the FMEA decides what operators check, which is why the analysis, the control plan and the standard work must change together or not at all. Upward, the floor feeds the analysis: quality alerts, audit findings and repeat deviations are the raw material of the next revision. A useful self-test for any plant: pick one operator check at random and trace it back to the failure mode it exists to catch. If nobody can, the FMEA was written for the auditor, not for the process.
Common mistakes
What bad looks like
- The FMEA is written the week before the certification audit and not opened again until the next one
- Scores swing ten points depending on who attends the meeting
- Recommended actions carry no owner, no date, and a follow-up column that is never filled
- The controls column lists checks no operator at the station recognizes
- One engineer owns every FMEA in the plant, and then leaves
What good looks like
- The revision log shows entries dated after complaints, escapes and process changes
- Scoring anchors written once from company history and reused in every session
- Every High priority has an owner, a date, and a rescore after verification at the process
- Every listed control traceable to standard work or an audit question
- Operators can name the top failure mode their checks exist to catch
After the analysis: what happens next
A scored FMEA points at a short list of modes where another instruction will not help. The natural successor for those rows is error-proofing: a device that prevents the mistake or flags it at the station, chosen and built the way the poka-yoke guide describes. Each implemented device then flows back as a lower occurrence or detection score, which is how the analysis records progress instead of just risk.
TeamGuru has no FMEA module; the worksheet stays where your team keeps it. What TeamGuru adds is the evidence that tells you when to revise it. Every escape is raised on the line as a quality alert, with date, product and location on record, so the failures the analysis missed are there at the next revision. The KPIs behind your occurrence scores, such as defect rate per line or part, sit on a KPI dashboard. When one climbs, you know which rows to rescore before the annual review.
On the roadmap, FMEA and its sibling methods run in parallel with kaizen and feed the Obeya and management review rhythm, where recurrence and risk get reviewed monthly instead of rediscovered annually.
Take this with you
The diagram from this guide as a shareable image, free to reuse in internal training and workshops.
Download PNGFrequently asked questions
What does FMEA stand for?
What is the difference between DFMEA and PFMEA?
What happened to RPN?
How often should an FMEA be updated?
Who should participate in an FMEA?
How detailed should the process steps be?
How TeamGuru runs this