Guía de implementación
AMEF/AMFE (FMEA): análisis de modos y efectos de falla.
El análisis de modos y efectos de falla (AMEF en México, AMFE en España; FMEA) es un método estructurado para anticipar cómo puede fallar un proceso, qué costaría cada falla y qué controles la evitan o la detectan antes que el cliente. El taller de valoración es solo el principio: el AMEF se gana su lugar con la disciplina de revisión, se reabre tras cada queja, escape y cambio de proceso, y decide qué verifica el plan de control.
Qué es el AMEF, y qué tipo cubre esta página
El AMEF es anticipación sistemática. Para cada paso de un proceso, un equipo hace cuatro preguntas en orden: cómo puede fallar este paso (el modo de falla), qué provocaría esa falla aguas abajo y en el cliente (el efecto), qué la haría ocurrir (la causa) y qué existe hoy para prevenirla o detectarla (los controles actuales). Las valoraciones de severidad, ocurrencia y detección (severity, occurrence, detection: S, O y D) convierten las respuestas en prioridades, y las prioridades en acciones con responsables.
Hay dos tipos principales. Un AMEF de diseño (DFMEA) pregunta cómo puede fallar el producto mismo durante su uso, y pertenece a ingeniería de producto. Un AMEF de proceso (PFMEA) pregunta cómo la manufactura puede producir una pieza defectuosa aunque el diseño sea correcto, y pertenece a la planta. Esta página se centra en el PFMEA, porque ahí el análisis o se conecta con lo que los operadores verifican de verdad, o muere en silencio.
Y morir es lo habitual. El AMEF más común en la industria es una hoja de cálculo valorada una vez durante el lanzamiento, archivada para el auditor y nunca reabierta, ni siquiera la semana en que llega una queja del cliente que el análisis pasó por alto o predijo. Ese documento es papel mojado. El valor de un AMEF no está en el taller inicial; está en la disciplina de volver a él cada vez que la realidad lo contradice, y en dejar que decida qué verifica el plan de control en el proceso.
Dónde encaja el AMEF en la hoja de ruta de transformación
En la hoja de ruta de despliegue de TeamGuru, el AMEF pertenece a la práctica de equipos y métodos de la etapa «Mejorar», junto con SMED, TPM y poka-yoke. No es, y esto es deliberado, una herramienta del primer día. Un AMEF rinde donde la planta ya captura sus problemas, porque el historial de problemas alimenta valoraciones de ocurrencia honestas y expone los modos que el primer taller pasó por alto. El análisis de causa raíz y acciones correctivas aporta ese historial, y el AMEF se lo devuelve decidiendo qué verifica el plan de control en cada estación.
- Antes Gestión diaria
- Está aquí SMED, TPM, AMEF y Poka-Yoke
- En paralelo Kaizen
- Después Obeya y revisión por la dirección
Cuándo el AMEF se vuelve desperdicio
El AMEF tiene mala fama en muchas plantas, y se la gana de tres formas muy concretas:
- Un solo ingeniero escribe los AMEF de toda la planta desde su escritorio. El resultado son cientos de filas que nadie del proceso ha visto, con valoraciones de ocurrencia adivinadas en lugar de recordadas. Un análisis que el equipo no construyó es un documento, y los documentos no cambian el comportamiento.
- Los debates sobre la valoración duran más que las conversaciones sobre las acciones. Cuando un equipo dedica veinte minutos a discutir si la ocurrencia es 5 o 6 y cuatro minutos a qué hacer con el modo principal, la reunión está optimizando el número equivocado.
- Cada producto nuevo empieza en una hoja en blanco. Si existe un AMEF de familia o de línea base para un proceso similar, empiece ahí y analice las diferencias. Las hojas en blanco reproducen las omisiones antiguas y queman la paciencia del equipo en filas que se resolvieron hace años.
El remedio para las tres es el mismo: alcance pequeño, construir con las personas que operan el proceso y gastar las horas ahorradas en acciones en lugar de en filas.
Cómo construir un AMEF que viva
Un AMEF vivo se construye en sesiones cortas, cerca del proceso, con las personas que saben cómo falla, y sale de cada sesión con acciones y no solo con valoraciones.
-
Acote un solo proceso y recórralo antes de analizarlo.
Elija una línea o una familia de procesos, recórrala estación por estación y anote los pasos con el requisito que cada uno debe cumplir. Una fila por función de la estación es el nivel de detalle correcto: «apretar cuatro conexiones hidráulicas a 25 Nm» puede fallar de maneras que vale la pena analizar; «tomar el atornillador» no.
-
Parta del AMEF de familia si ya existe uno.
Un análisis base de un proceso similar ya contiene la mayoría de los modos, los efectos y las valoraciones calibradas. Cópielo y analice después qué es distinto en este producto y en esta línea. En las diferencias es donde se esconde el riesgo nuevo.
-
Haga sesiones transversales de unos 90 minutos por paso del proceso.
Ingeniería de proceso, calidad, un operador que opere la estación y mantenimiento cuando el comportamiento del equipo importe. Para cada paso: cómo puede fallar, qué ocurre aguas abajo y en el cliente, qué lo provoca y qué controles existen hoy. Controles actuales significa actuales: un control planeado, informal o que «casi siempre» se hace no es un control, y listarlo de todos modos corrompe la valoración de detección.
-
Valore contra anclas escritas, y rápido.
Use escalas ancladas, calibradas una sola vez para toda la empresa (la tabla de abajo es un punto de partida), y ponga un límite de tiempo a cada fila. Discrepar por un punto nunca cambia la decisión siguiente. La banda de prioridad sí, así que discuta sobre bandas y no sobre decimales.
-
Dé a cada prioridad alta una acción con responsable y fecha, y actualice el plan de control en la misma reunión.
El AMEF y el plan de control son dos vistas de una misma decisión: qué riesgo aceptamos y qué verificamos por ello. Si los actualizan personas distintas en reuniones distintas, en un trimestre ya se contradicen. Vuelva a valorar la ocurrencia o la detección solo cuando la acción esté verificada en el proceso, no cuando esté planeada.
-
Nombre los disparadores de revisión y al responsable del documento.
El AMEF se reabre tras cada queja de cliente dentro de su alcance, cada escape interno, cada cambio de proceso, de producto o de equipo, y siempre que la resolución de problemas descubra un modo que el análisis no contiene. Un responsable con nombre y apellido vigila los disparadores.
Esos disparadores no son un trámite que acompaña al método. Son el método. El primer taller produce una hipótesis sobre cómo falla el proceso; cada queja y cada escape es un resultado de prueba: la realidad encontró un modo que el análisis omitió, o venció un control en el que el análisis confiaba. Por eso una investigación de causa raíz madura pregunta, como cuestión estándar: ¿estaba este modo en el AMEF? La respuesta actualiza el análisis de una de tres maneras. El modo faltaba: agréguelo. El modo estaba con una valoración de ocurrencia complaciente: revalórelo y actúe. El modo estaba y el control listado no lo detectó: la valoración de detección era ficción, así que corrija el control y no solo el número. Los casos que llegan al cliente y se tramitan como 8D hacen explícito este ciclo: la disciplina D7, la prevención, existe precisamente para llevar la lección al AMEF y al plan de control del producto afectado y de sus hermanos.
Ejemplo resuelto: tres filas de un PFMEA
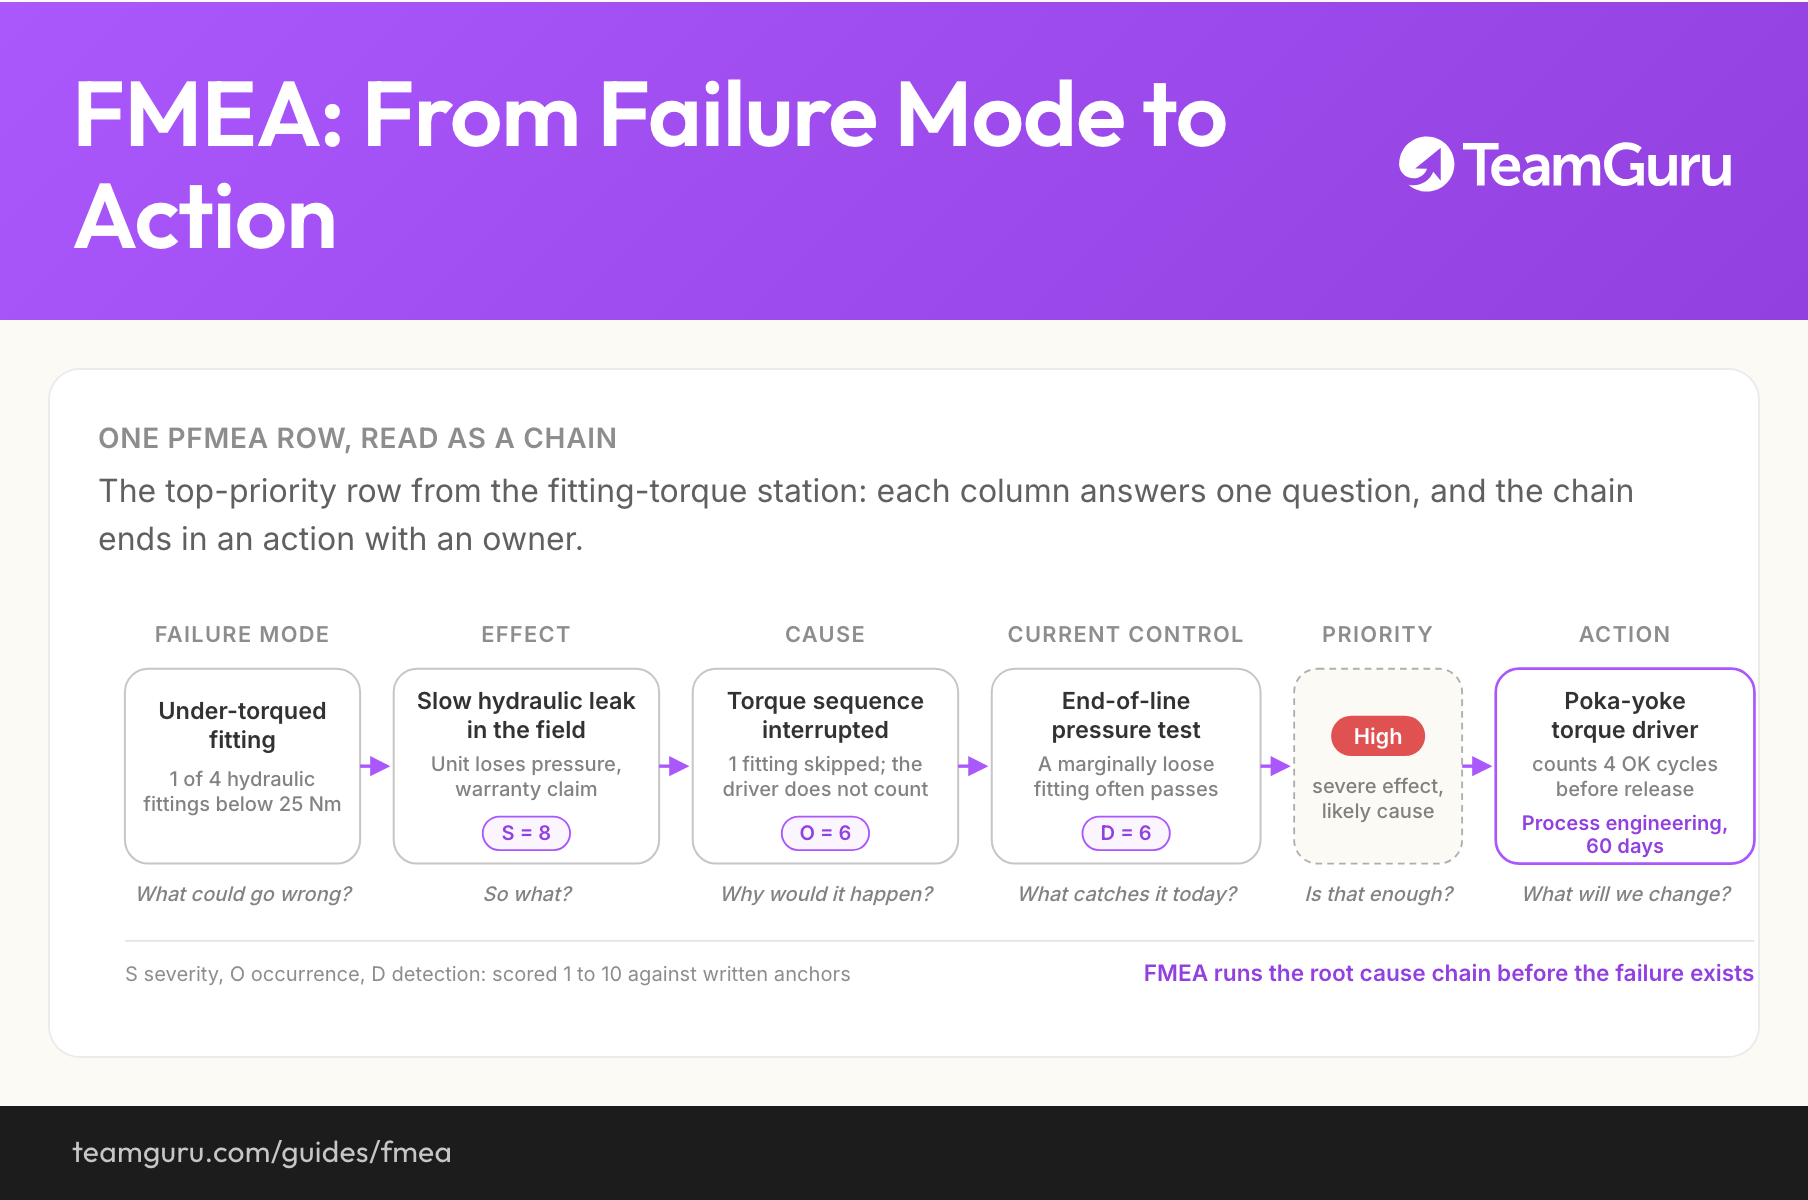
El extracto de abajo corresponde a la estación de torque de conexiones del fabricante de componentes de 450 personas que sirve de ejemplo en todo este sitio. La estación aprieta cuatro conexiones hidráulicas por unidad a 25 Nm; con 456 unidades al día son unas 1,800 operaciones de torque, volumen suficiente para que cualquier error que el proceso permita acabe ocurriendo en el turno de alguien. Las valoraciones usan la convención de 1 a 10, anclada en la sección siguiente. Los números son ilustrativos, pero internamente consistentes.
One PFMEA row, read as a chain
The top-priority row from the fitting-torque station: each column answers one question, and the chain ends in an action with an owner.
| Modo de falla | Efecto (S) | Causa (O) | Controles actuales (D) | Prioridad | Acción recomendada |
|---|---|---|---|---|---|
| Conexión con torque insuficiente | Fuga hidráulica lenta en campo, la unidad pierde presión, reclamación de garantía S = 8 | Secuencia de torque interrumpida, se omite una de las cuatro conexiones; el atornillador no lleva la cuenta de los aprietes O = 6 | Valores de torque en la instrucción de trabajo; prueba de presión al 100 por ciento al final de línea, que una conexión ligeramente floja suele superar D = 6 | Alta | Atornillador con poka-yoke y verificación de conteo: la estación libera la unidad solo tras cuatro ciclos de torque OK. Responsable: ingeniería de proceso, 60 días. |
| Conexión con torque insuficiente | Fuga hidráulica lenta en campo, la unidad pierde presión, reclamación de garantía S = 8 | El embrague del atornillador queda en el ajuste equivocado tras un cambio entre tamaños de conexión O = 3 | Hoja de preparación en la estación; verificación de torque de la primera pieza con llave calibrada D = 5 | Media | Valores de torque preconfigurados que se cargan al escanear el código de barras de la orden de trabajo; verificación mensual de torque añadida a la auditoría de capa 2. Responsable: ingeniería de manufactura, 90 días. |
| Conexión con rosca cruzada | Fuga inmediata en la prueba de presión de final de línea, la conexión se desecha y se retrabaja en planta S = 6 | Desalineación al iniciar la rosca a mano O = 3 | Enroscar dos vueltas completas a mano según el trabajo estandarizado; la prueba de presión detecta este modo de forma confiable D = 3 | Baja | Ninguna. Se vigila con el registro de fallas de la prueba; revisar si la tasa de retrabajo sube. |
Lea las tres filas como tres desenlaces distintos del mismo análisis. La primera fila es la razón por la que existe el AMEF: un efecto grave, una causa que vive dentro de las interrupciones normales del día y un control de detección que parece más fuerte de lo que es. La prueba de presión corre en cada unidad, pero una conexión con torque ligeramente bajo aguanta la presión durante una prueba de 30 segundos y empieza a rezumar semanas después con el ciclado térmico. Una valoración de detección honesta registra lo que el control atrapa de verdad, no el hecho de que exista un control.
La segunda fila comparte el efecto grave, pero la causa es más rara y está parcialmente controlada, así que se gana una acción programada y no una urgente. La tercera fila es la que muchos equipos se niegan a escribir: un modo que los controles actuales sí manejan, prioridad baja, sin acción. Un AMEF que ata acciones a todo no prioriza nada. La acción recomendada de la primera fila, sustituir la vigilancia humana por un dispositivo que cuenta, es el final clásico de una fila de prioridad alta; la guía de poka-yoke explica cómo elegirlo y construirlo.
Valoración de severidad, ocurrencia y detección
La severidad, llamada también gravedad, valora el efecto; la ocurrencia valora la causa; y la detección valora la capacidad de los controles actuales para atrapar el modo antes de que salga de la planta. Las tres corren de 1 a 10 por convención, y ninguna significa nada hasta que su empresa escribe sus propias anclas: la misma fuga es un 4 en un negocio y un 9 en otro. La tabla de abajo es un punto de partida para esa calibración, con anclas en las bandas que más importan.
| Valor | Severidad del efecto | Ocurrencia de la causa | Detección por los controles actuales |
|---|---|---|---|
| 9 a 10 | Efecto de seguridad o regulatorio, posiblemente sin aviso previo | Casi inevitable: se ve cada semana en este proceso o en uno casi idéntico | No hay control actual, o el control no puede detectar este modo |
| 7 a 8 | Pérdida de la función principal: falla en campo, la línea del cliente se detiene | Frecuente: aproximadamente una vez al mes en procesos similares | Solo inspección manual o muestreo |
| 5 a 6 | Desempeño degradado: retrabajo interno, desecho, fallas en prueba | Ocasional: varias veces al año | Una prueba o un calibre aguas abajo detecta la mayoría de los casos, no todos |
| 3 a 4 | Molestia menor: defecto cosmético, se necesita un ajuste | Rara: vista una o dos veces en la memoria de la planta | Detección automática en la estación o muy cerca de ella |
| 1 a 2 | Sin efecto que el cliente o el proceso siguiente lleguen a notar | Prácticamente eliminada por un control de prevención | El error no puede pasar: un dispositivo lo bloquea o lo rechaza en el origen |
Dos reglas de honestidad mantienen útil la valoración. Primera, calibre las escalas una sola vez, con anclas tomadas de su propio historial, y reutilícelas en cada sesión. Las valoraciones que se mueven con el humor de la sala producen los saltos de diez puntos que enseñan a los equipos a desconfiar del método. Segunda, no deje que la aritmética mande sobre el criterio. El clásico número de prioridad de riesgo (NPR) multiplicaba S, O y D, y podía colocar un modo de severidad 9 con ocurrencia moderada por debajo de otro trivial pero frecuente; el manual de AIAG y VDA de 2019 sustituyó el NPR por tablas de Prioridad de Acción que ponderan primero la severidad.
No hacen falta las tablas completas para que esto funcione. Esta página usa una lógica simple de tres bandas, enunciada una vez y aplicada de forma consistente: alta cuando un efecto grave (severidad 7 o más) se junta con ocurrencia 4 o más; media cuando un efecto grave se junta con ocurrencia menor pero detección de 5 o peor; baja en los demás casos. Sus bandas pueden ser otras. Lo que importa es que estén escritas, que la severidad pese más que nada y que sea la banda, y no el debate, la que decida a dónde van las acciones.
Conectar el AMEF con el piso de producción
Un control que solo existe en una columna de hoja de cálculo es ficción. Todo control de prevención del AMEF debe poder encontrarse como un paso del trabajo estandarizado, y todo control de detección debe ser una verificación real que una persona con nombre y apellido realiza a una frecuencia definida. La valoración de detección da por hecho que esas verificaciones ocurren. Las auditorías de proceso por capas son la manera de comprobar ese supuesto, porque muestrean exactamente las verificaciones de las que depende el AMEF. Si una auditoría descubre que un control listado se omite o es impracticable, ha encontrado una corrección de la valoración de detección, no solo un hallazgo de auditoría.
El vínculo funciona en los dos sentidos. Hacia abajo, el AMEF decide qué verifican los operadores, y por eso el análisis, el plan de control y el trabajo estandarizado deben cambiar juntos o no cambiar. Hacia arriba, la planta alimenta el análisis: las alertas de calidad, los hallazgos de auditoría y las desviaciones repetidas son la materia prima de la siguiente revisión. Una comprobación útil para cualquier planta: tome al azar una verificación del operador y rastréela hasta el modo de falla que existe para atrapar. Si nadie puede hacerlo, el AMEF se escribió para el auditor y no para el proceso.
Errores comunes
Cómo se ve lo malo
- El AMEF se escribe la semana anterior a la auditoría de certificación y no se vuelve a abrir hasta la siguiente
- Las valoraciones se mueven diez puntos según quién asista a la reunión
- Las acciones recomendadas no llevan responsable ni fecha, y la columna de seguimiento nunca se llena
- La columna de controles lista verificaciones que ningún operador de la estación reconoce
- Un solo ingeniero es dueño de todos los AMEF de la planta, y luego se va
Cómo se ve lo bueno
- El registro de revisiones muestra entradas fechadas después de quejas, escapes y cambios de proceso
- Anclas de valoración escritas una vez a partir del historial de la empresa y reutilizadas en cada sesión
- Cada prioridad alta tiene responsable, fecha y una revaloración tras la verificación en el proceso
- Cada control listado es rastreable hasta el trabajo estandarizado o una pregunta de auditoría
- Los operadores saben nombrar el modo de falla principal que sus verificaciones existen para atrapar
Después del análisis: qué pasa a continuación
Un AMEF valorado apunta a una lista corta de modos donde otra instrucción de trabajo no va a ayudar. El sucesor natural de esas filas es la prevención de errores: un dispositivo que impide el error o lo señala en la estación, elegido y construido como describe la guía de poka-yoke. Cada dispositivo implementado regresa después como una valoración menor de ocurrencia o de detección, que es la forma en que el análisis registra el avance y no solo el riesgo.
TeamGuru no tiene un módulo de AMEF: la hoja sigue donde su equipo la mantiene. Lo que aporta son los datos que le dicen cuándo revisarla. Cada escape se levanta en la línea como alerta de calidad, con fecha, producto y ubicación, así que las fallas que el análisis no previó están a mano en la revisión. Los indicadores detrás de su puntuación de ocurrencia, como la tasa de defectos por línea o por pieza, están en un dashboard de KPI. Cuando uno sube, usted sabe qué filas volver a puntuar antes de la revisión anual.
En la hoja de ruta, el AMEF y sus métodos hermanos van en paralelo con el kaizen y alimentan el ritmo de Obeya y revisión por la dirección, donde la recurrencia y el riesgo se revisan cada mes en lugar de redescubrirse cada año.
Lléveselo consigo
El diagrama de esta guía como imagen, de uso libre en formaciones internas y talleres.
Descargar PNGPreguntas frecuentes
¿Qué significan las siglas AMEF y AMFE?
¿Cuál es la diferencia entre DFMEA y PFMEA?
¿Qué pasó con el NPR?
¿Cada cuánto se debe actualizar un AMEF?
¿Quién debe participar en un AMEF?
¿Con cuánto detalle deben describirse los pasos del proceso?
Cómo lo lleva a la práctica TeamGuru