The Manufacturing Transformation Framework
Build a Better Management Operating System.
A practical roadmap for building a world-class manufacturing operation: what to implement, in what order, and how the pieces connect.
The transformation roadmap.
Most transformations don't fail for lack of tools. They fail because the tools are introduced in isolation or in the wrong sequence.
Connected in one loop: strategy flows down into daily work, and what improvement learns feeds back into strategy.
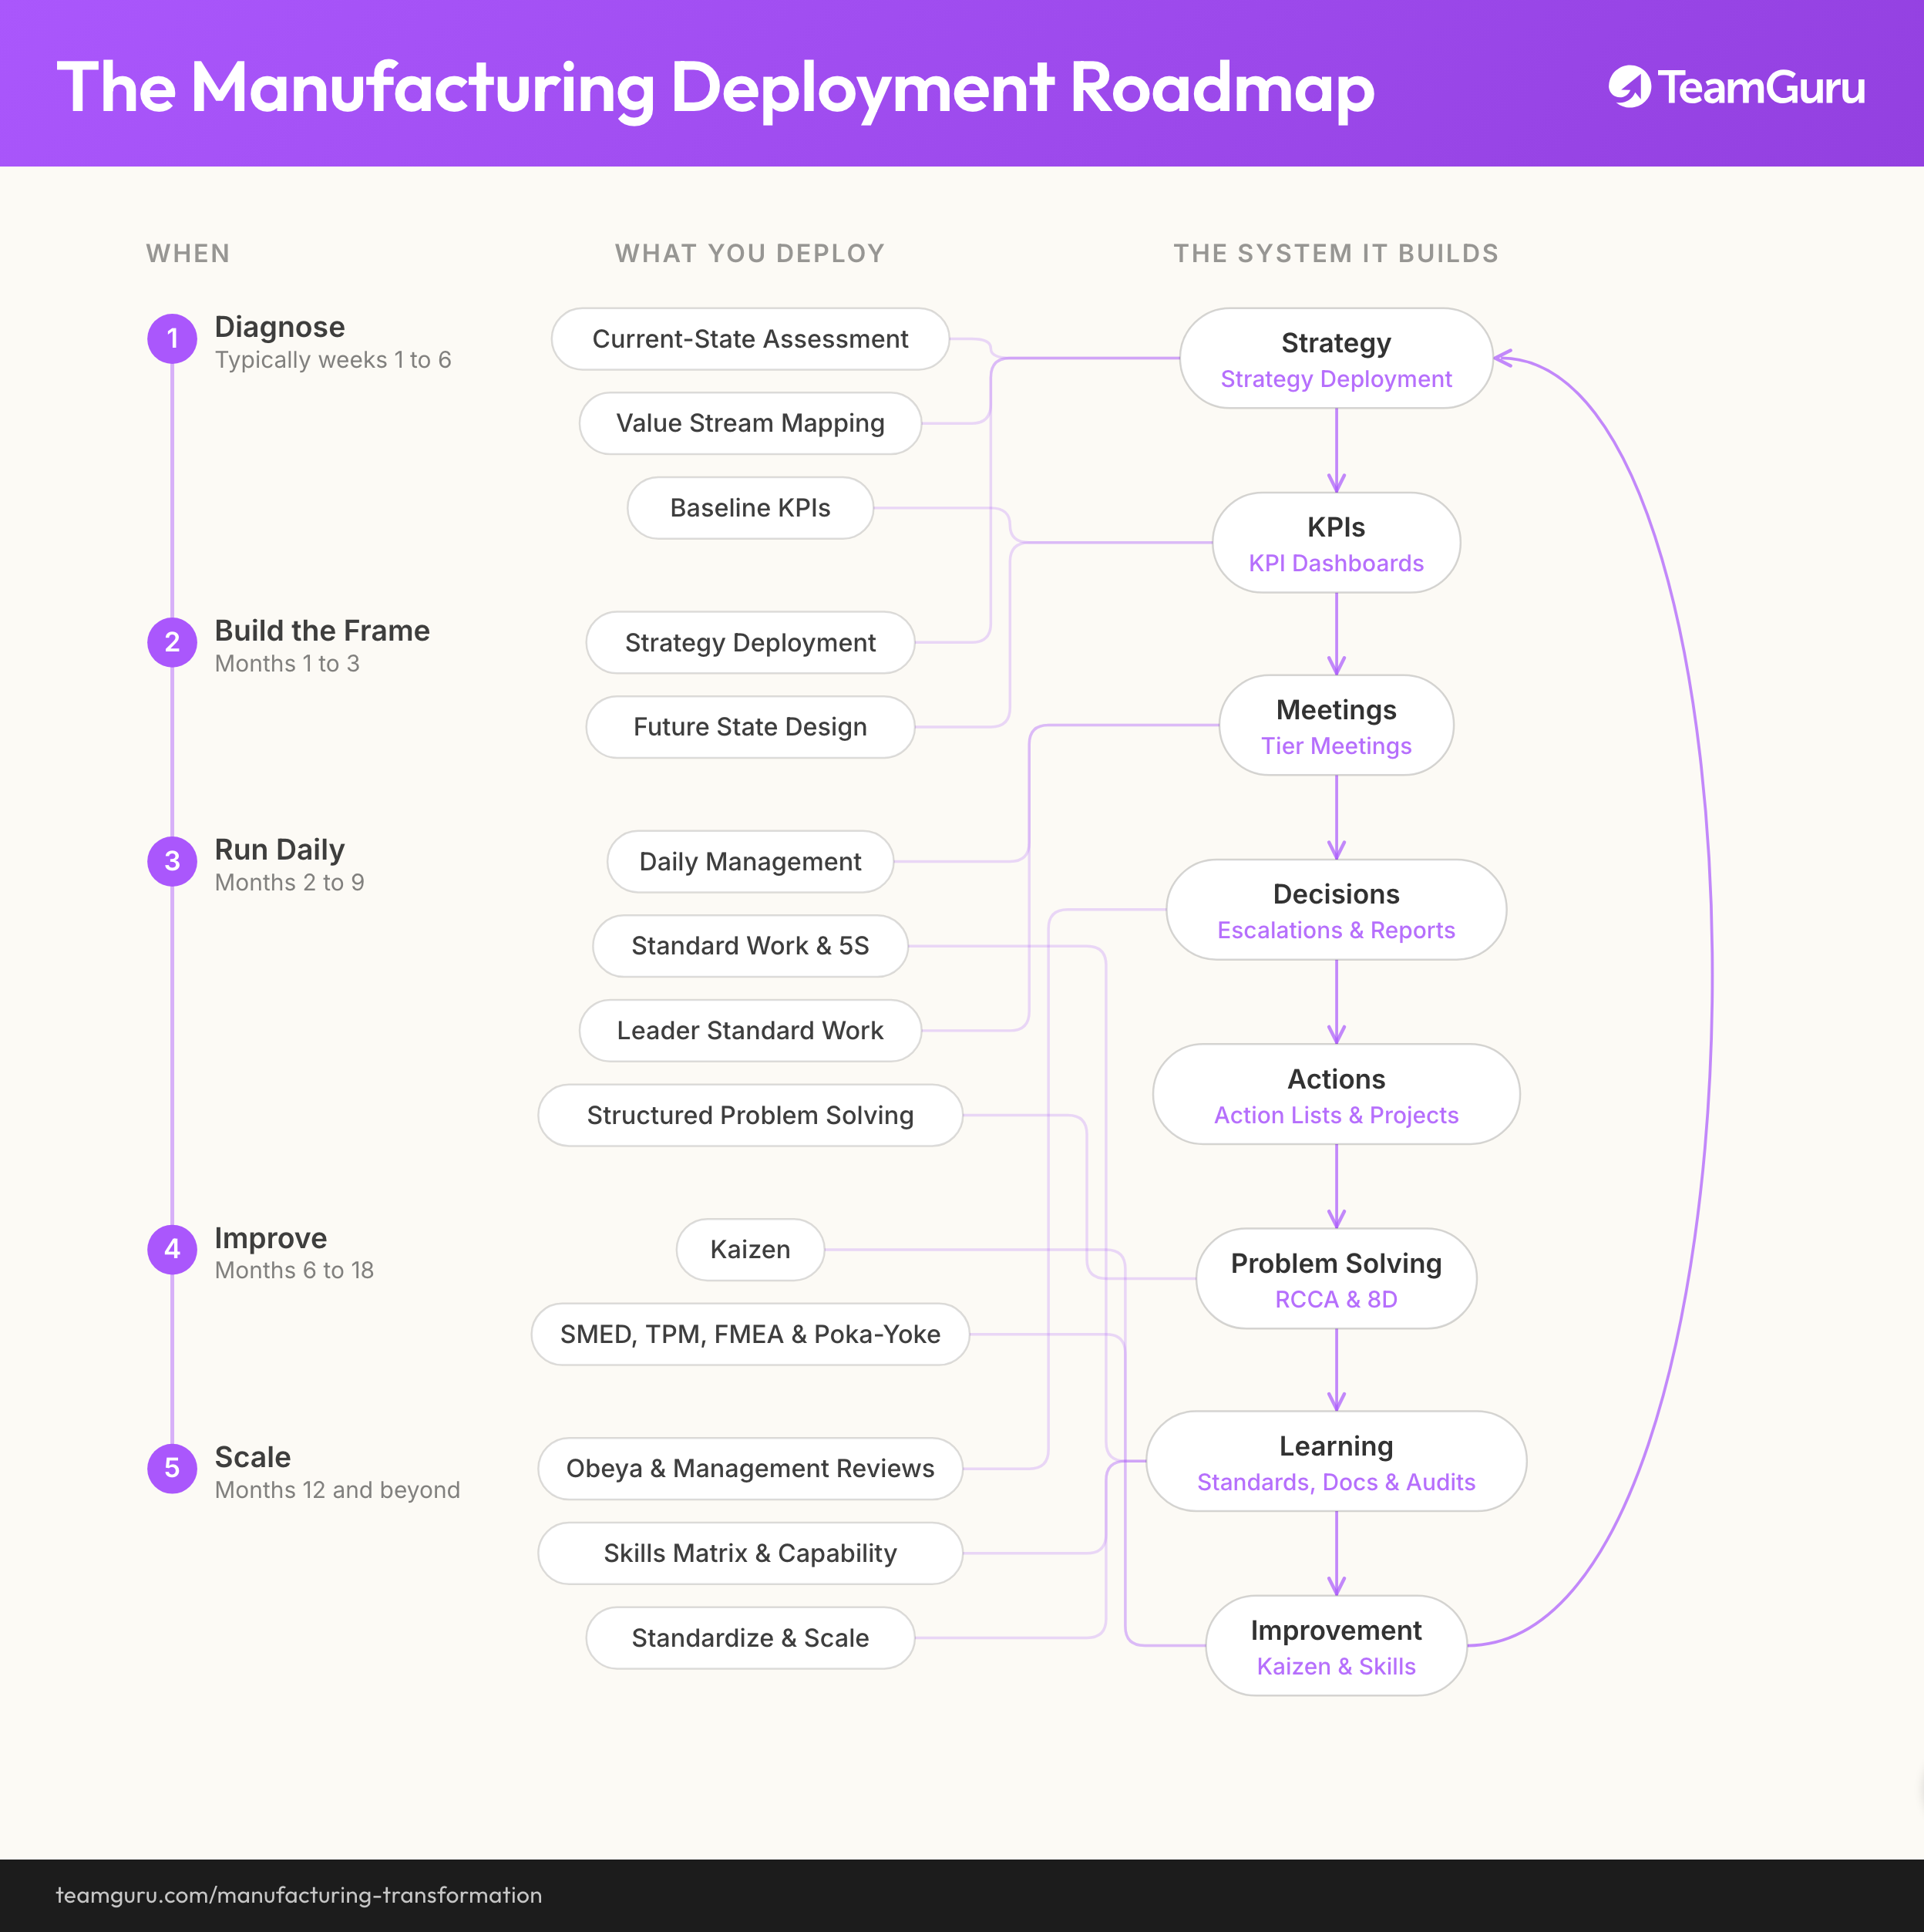
Now make it practical.
Explore each stage to see what to implement, why it matters, and the tools to use.
Diagnose
Typically weeks 1 to 6
See where value is lost before spending money and management attention.
Current-State Assessment Build a shared, evidence-based picture of how the plant and its management system actually run.
Build a shared, evidence-based picture of how the plant and its management system actually run.
Why now
Every later choice depends on an honest starting point that line leaders helped build and believe.
Watch out
Months of analysis. Two to four focused weeks is enough for a first pass.
You know it works when
A one-page case for change that leadership actually agrees on.
Value Stream Mapping Map how material and information really flow, and where time and value leak.
Map how material and information really flow, and where time and value leak.
Why now
Focuses everything that follows on the two or three streams that carry most volume or margin.
Watch out
Mapping every process instead of the value streams that matter.
You know it works when
A current-state map with a prioritized loss analysis.
Baseline KPIs Establish trusted numbers for safety, quality, delivery, inventory and productivity.
Establish trusted numbers for safety, quality, delivery, inventory and productivity.
Why now
Targets and daily management need a baseline the owners accept, not numbers disputed in every meeting.
Watch out
Building a 40-metric scorecard. Start with the few numbers that expose the constraint.
You know it works when
An accepted baseline for the SQDIP categories.
Build the Frame
Months 1 to 3
Set a few measurable priorities and design how value should flow.
Strategy Deployment Turn the diagnosis into three to five breakthrough objectives with named owners, using Hoshin Kanri and the X-Matrix.
Turn the diagnosis into three to five breakthrough objectives with named owners, using Hoshin Kanri and the X-Matrix.
Why now
Priorities must exist before daily routines, or the routines end up managing noise.
Watch out
Cascading targets without catchball, so numbers arrive without ownership.
You know it works when
A one-page X-Matrix every department head signed.
Future State Design Design the future flow and the KPI tree that will tell you it is working.
Design the future flow and the KPI tree that will tell you it is working.
Why now
Improvement without a target condition becomes a collection of local fixes.
Watch out
Designing the future state around a software purchase instead of around flow.
You know it works when
A future-state map for the priority streams plus a KPI tree with owners.
Run Daily
Months 2 to 9
Create daily visibility and routines that catch deviations the day they happen.
Daily Management Tier meetings, SQDIP boards and escalation rules that turn misses into owned actions the same day.
Tier meetings, SQDIP boards and escalation rules that turn misses into owned actions the same day.
Why now
Until deviations are seen and acted on daily, optimization leaks away faster than it accumulates.
Watch out
Launching boards and meetings without escalation rules, so problems are visible but stuck.
You know it works when
A missed KPI reliably produces an action with an owner and a date.
Standard Work & 5S Stable, visual working conditions so deviations are obvious and improvements have something to hold onto.
Stable, visual working conditions so deviations are obvious and improvements have something to hold onto.
Why now
Runs alongside daily management: standards make the daily system hold. You do not wait for one to start the other.
Watch out
Standards written by engineering that operators never touched.
You know it works when
Standard work on the critical operations, followed and audited.
Leader Standard Work Defined leadership routines that keep the daily system running when attention moves elsewhere.
Defined leadership routines that keep the daily system running when attention moves elsewhere.
Why now
The daily management system survives vacations, turnover and audits only if leader routines are explicit.
Watch out
Treating it as an inspection checklist instead of coaching time at the process.
You know it works when
Supervisor routines running visibly without the plant manager forcing them.
Structured Problem Solving 5 Whys, A3, RCCA and 8D applied at the right level, so solved problems stay solved.
5 Whys, A3, RCCA and 8D applied at the right level, so solved problems stay solved.
Why now
Starts once daily management produces a stream of real deviations worth root-causing. Earlier, training has nothing to bite on.
Watch out
Declaring victory at countermeasure implemented instead of at recurrence prevented.
You know it works when
Repeat-problem rate tracked and falling on the top categories.
Improve
Months 6 to 18
Raise throughput, quality and flexibility on a base that can hold the gains.
Kaizen A pipeline from operator ideas to implemented, verified improvements.
A pipeline from operator ideas to implemented, verified improvements.
Why now
Improvement volume is only worth generating once ownership and follow-up exist to land it.
Watch out
Kaizen events as morale theater with no follow-up owner.
You know it works when
Measured, finance-verified benefits per improvement.
SMED, TPM, FMEA & Poka-Yoke Targeted methods for changeovers, downtime, process risk and error-proofing, applied to the constraint first.
Targeted methods for changeovers, downtime, process risk and error-proofing, applied to the constraint first.
Why now
These pay off fastest where daily management already holds gains. On an unstable base they erode within weeks.
Watch out
Optimizing non-constraint equipment because it is easy.
You know it works when
Shorter changeovers and less downtime on the lines that limit delivery.
Scale
Months 12 and beyond
Turn local wins into a system that survives leadership changes and spreads across sites.
Obeya & Management Reviews One visual room, physical or digital, where strategy, KPIs, projects and problems are reviewed together.
One visual room, physical or digital, where strategy, KPIs, projects and problems are reviewed together.
Why now
Governance closes the loop: decisions made where the whole system is visible, not in slide meetings.
Watch out
An Obeya that displays data nobody acts on. Governance is decisions, not wallpaper.
You know it works when
Reviews that shift from explaining results to making decisions.
Skills Matrix & Capability Visible skills and qualifications per team, tied to the capabilities each area needs next.
Visible skills and qualifications per team, tied to the capabilities each area needs next.
Why now
Start a basic version as soon as standard work exists. Build the full development system here.
Watch out
Tracking training attendance instead of demonstrated capability at the process.
You know it works when
Skills development tied to the roadmap, not to course catalogs.
Standardize & Scale Standard audits, Yokoten and playbooks that replicate what works across plants with local ownership.
Standard audits, Yokoten and playbooks that replicate what works across plants with local ownership.
Why now
Scaling by mandate copies boards, not behavior. Scale when one site runs the system without being pushed.
Watch out
Copying site A's boards to site B without building site B's ownership.
You know it works when
Two or more sites sharing standards and comparing results without translation.
Not sure where your plant stands? The free WCM self-assessment rates 23 practices across the pillars and tells you which area to strengthen first. Seven minutes, no email. Take the WCM self-assessment →
What this looks like in practice.
A 450-person industrial components manufacturer
A typical starting point for a company of this size: on-time delivery around 79%. Schedules change daily and expediting is a full-time habit. Shift handovers vary by who is on. Quality issues repeat. More than 300 actions are open across spreadsheets and inboxes. Improvement projects run without clear benefits. KPIs live in separate files per department, and the monthly management review is spent explaining last month.
| When | Focus | Example moves | Result |
|---|---|---|---|
| Months 0 to 2 | Diagnose | VSM on the two main product families, loss analysis, management-system assessment | Shared view that scheduling churn and unplanned downtime on two lines drive most late orders |
| Months 2 to 4 | Build the Frame | Future-state flow for the constraint lines, KPI tree, X-Matrix with six initiatives, three deferred | One page of priorities every department head signed |
| Months 3 to 9 | Run Daily | Tier meetings on all shifts, SQDIP per line, escalation rules, standard work on the constraint, RCCA on the top five recurring problems | Deviations answered in hours instead of at month end; top repeat problems closed with verified causes |
| Months 9 to 15 | Improve | SMED on the two constraint lines, TPM routines, Poka-Yoke on the top defect mode, Kaizen pipeline with benefit tracking | Smaller batches without lost capacity; downtime and the top defect measurably reduced |
| Months 12 and beyond | Scale | Weekly Obeya review, standard audits, skills development plan, rollout to the second plant | Reviews shifted from explaining results to making decisions; system repeatable across both plants |
A year in, nothing about this sequence is magic. The plant did less than before, in a stricter order: diagnose first, set a few priorities, get daily control, fix causes permanently, then improve and scale what worked. TeamGuru appears throughout not as the transformation itself but as the place where the KPIs, meetings, actions, problems and standards stay connected, so the system holds when attention moves elsewhere.
How this relates to World Class Manufacturing.
World Class Manufacturing (WCM) describes a comprehensive approach to operational excellence, commonly organized as pillars spanning safety, quality, cost, delivery, maintenance, people development and continuous improvement.
WCM describes many of the capabilities a world-class operation needs. This roadmap answers a different practical question: in what order should you build them?
| World-class manufacturing challenge | Roadmap stage |
|---|---|
| Understand losses and current performance | 1 Diagnose |
| Align objectives, priorities and measures | 2 Build the Frame |
| Establish standards and daily control | 3 Run Daily |
| Eliminate causes and improve performance | 4 Improve |
| Standardize, develop people and replicate | 5 Scale |
For the full picture, including where the term comes from, the technical and managerial pillars, and how to implement WCM stage by stage, read the World Class Manufacturing guide. Already running a WCM program? See which pillar runs where in TeamGuru.
Where TeamGuru fits.
Strategy, KPIs, meetings, actions, problem-solving, audits and skills stay connected in one place. You have seen the touchpoints inside each practice above; two examples of how that looks in the product:
The X-Matrix as a working object: objectives, KPIs, initiatives and owners stay linked, from the boardroom to this week's actions.
Daily meetings where the KPI, the discussion, the action, the owner and the escalation live in one thread.
Ready to plan the work?
See how TeamGuru could support your deployment roadmap, from the first assessment to a connected multi-site operating system.