Průvodce zavedením
KPI ve výrobě: ukazatele a metriky.
KPI ve výrobě jsou měřená čísla, podle kterých závod řídí sám sebe. Obvykle se člení na bezpečnost, kvalitu, dodávky, zásoby a produktivitu (SQDIP). Ukazatele, na kterých opravdu záleží, mají tři vlastnosti: měří se přímo na procesu, každé číslo má jmenovitého vlastníka a každé podpírá rozhodnutí na pravidelné poradě. Měřte málo čísel, která někdo vlastní, ne hodně čísel, která nevlastní nikdo. KPI bez vlastníka a bez rozhodnutí je vykazování, ne řízení.
K čemu jsou KPI ve výrobě
Výrobní KPI existuje proto, aby podepřelo rozhodnutí. To je celá jeho práce. Včasnost dodávek na 87 procentech není informace, dokud to číslo někdo nevlastní, neví, proč je 87 a ne 94, a nepoužije ho na poradě k rozhodnutí, kam půjde další protiopatření. Všechno ostatní, co se měří, a závody toho měří opravdu hodně, je metrika: možná užitečná, občas se do ní někdo podívá, ale závod se podle ní neřídí.
Představte si malou hierarchii. Nahoře stojí pět až osm KPI na úrovni závodu, obvykle členěných na bezpečnost, kvalitu, dodávky, zásoby a produktivitu, tedy podle struktury SQDIP, která organizuje i denní tabule. Pod nimi si každý provoz nebo linka nese vlastní tři až pět čísel, se kterými jeho směna umí opravdu pohnout. Ještě níž leží všechny výrobní ukazatele, které systémy stejně zaznamenávají. Typická chyba je splácnout tuhle hierarchii do jednoho přehledu o 40 řádcích, kde je všechno stejně důležité, což znamená, že důležité není nic.
Tahle stránka definuje klíčové ukazatele, uvádí vzorce a ukazuje, jak vybrat startovní sadu a změřit její výchozí hodnoty. Průvodce SQDIP tabulí popisuje denní tabuli postavenou z těchto čísel, průvodce OEE jde do hloubky v celkové efektivnosti zařízení a průvodce stromem KPI se věnuje kaskádování ukazatelů závodu až na úroveň směny.
Kde KPI leží v transformační roadmapě
V roadmapě nasazení TeamGuru je toto téma praktikou Výchozí KPI ve fázi Diagnóza. Navazuje na analýzu současného stavu, která pojmenuje obchodní problém, jemuž mají KPI sloužit, a běží souběžně s mapováním hodnotového toku, které dodá změřená čísla jako průběžná doba, WIP a čas přetypování. Výchozí hodnoty pak vstupují do nasazení strategie, které na nich staví cíle, a do denního řízení výroby, které je probírá každý den.
Kdy víc KPI situaci zhorší
Měření působí jako pokrok, a přesně proto se s ním přehání. Každé číslo přidané do přehledu stojí pozornost a pozornost je v závodě ten nejvzácnější zdroj. Než přidáte další KPI, projděte seznam níže. Většina rozbitých systémů měření selhává jedním ze čtyř způsobů a ani jeden se nespraví tím, že budete měřit víc.
- Přehled o 40 ukazatelích. Nikdo neumí pojmenovat vlastníka řádku 23, porada klouže po povrchu místo toho, aby rozhodovala, a tři čísla, na kterých záleží, se utopí v 37 ostatních. Když měsíční porada nestihne probrat každé KPI, je moc dlouhý seznam, ne moc krátká porada.
- Průměry, které skryjí rozptyl. Měsíční OTIF na 91 procentech může skrývat jeden bezchybný a jeden katastrofální týden, a poučení leží právě v té katastrofě. Na pracovní úrovni čtěte trendy a rozdělení, jediné zprůměrované číslo si nechte do souhrnů.
- Ukazatele na efekt. Vyrobené kusy vypadají na zdi skvěle a odměňují nadprodukci, tedy nejhorší ze sedmi druhů plýtvání. Každé číslo o výrobě bez jmenovatele, tedy bez poptávky, kvality nebo času, lichotí vynaložené snaze místo toho, aby měřilo výkon.
- KPI, se kterými na úrovni směny nikdo nepohne. Obrátka zásob na tabuli výrobní buňky je šum: tým s ní ze svého pracoviště pohnout nemůže. Kaskádujte místo toho: buňka sleduje dodržování plánu a výtěžnost na první pokus a ty se skládají do obrátky, kterou vlastní ředitel závodu.
Tabulka definic: klíčové KPI podle kategorií SQDIP
Těchto 17 ukazatelů pokrývá to, z čeho si většina závodů opravdu potřebuje vybrat. Vzorce jsou schválně napsané běžným jazykem: pokud číslo nejde u tabule vysvětlit jednou větou, ve výrobě nepřežije. Žádný závod by neměl sledovat všech 17. Startovní sadu vyberte podle pravidel v další sekci.
| KPI | Definice | Vzorec | Typické využití |
|---|---|---|---|
| Bezpečnost | |||
| TRIR | Total recordable incident rate: evidované pracovní úrazy a nemoci z povolání přepočtené na 100 zaměstnanců na plný úvazek za rok. Standardní zpětný ukazatel bezpečnosti. | TRIR = (evidované případy x 200 000) / celkem odpracovaných hodin | Porovnává bezpečnost mezi závody a v čase. Konstanta 200 000 je 100 pracovníků krát 2 000 hodin. |
| Míra hlášení skoronehod | Kolik skoronehod a nebezpečných stavů lidé za období nahlásí. Předstihový ukazatel: rostoucí počet obvykle znamená rostoucí důvěru, ne rostoucí nebezpečí. | Počet nahlášených skoronehod za měsíc (často na 100 zaměstnanců) | Ukáže, jestli bezpečnostní systém najde problémy dřív, než se z nich stanou úrazy. |
| Kvalita | |||
| Výtěžnost na první pokus (FPY) | Podíl kusů, které projdou jedním krokem procesu správně napoprvé, bez opravy, přepracování nebo zmetku. | FPY = kusy dobré napoprvé / zahájené kusy | Nejpoctivější jediné číslo o kvalitě jednoho kroku, protože počítá i opravy, které zmetkovitost skryje. |
| Celková průchozí výtěžnost (RTY) | Pravděpodobnost, že kus projde napoprvé všemi kroky celého toku: součin výtěžností FPY jednotlivých kroků. | RTY = FPY kroku 1 x FPY kroku 2 x ... x FPY kroku n | Odhalí skrytou továrnu. Pět kroků po 97 procentech dá RTY jen 86 procent. |
| Zmetkovitost | Podíl zahájených kusů (nebo výrobních nákladů) ztracených jako zmetky. | Zmetkovitost = zmetkované kusy / zahájené kusy | Vyčíslí ztrátu materiálu. Čtěte ji spolu s FPY, která zachytí i opravy, o kterých zmetkovitost mlčí. |
| PPM (vadné díly na milion) | Počet vadných dílů na milion kusů dodaných zákazníkovi. | PPM = (vadné kusy / dodané kusy) x 1 000 000 | Kvalita z pohledu zákazníka, číslo, které se objevuje na hodnocení dodavatelů. |
| Náklady na nekvalitu (COPQ) | Všechny peníze vydané proto, že něco nebylo správně napoprvé: zmetky, opravy, reklamace, vratky a nadbytečné kontroly. | COPQ v % = (zmetky + opravy + reklamace + náklady na kontrolu) / tržby | Převede kvalitu na peníze: podklad pro priority a pro měsíční přezkoumání vedením. |
| Dodávky | |||
| Včasnost dodávek (OTD / OTIF) | Podíl zákaznických objednávek dodaných v přislíbeném termínu. OTIF navíc žádá: kompletně a bez chyb. | OTIF = objednávky dodané včas a kompletně / všechny objednávky | Pohled zákazníka na dodávky. Měřte proti prvnímu příslibu, ne proti poslednímu přeplánování. |
| Dodržování plánu | Jak přesně výroba v daném intervalu sledovala plán, v množství i v pořadí. | Dodržování plánu = kusy vyrobené podle plánu / plánované kusy | Oddělí zpoždění, která způsobilo plánování, od těch, která způsobila výroba. |
| Průběžná doba | Čas od objednávky k dodání, nebo od vstupu materiálu do závodu po jeho odjezd z rampy. Včetně čekání ve frontách. | Průběžná doba = datum dodání minus datum objednávky (nebo dny od rampy k rampě) | Číslo na úrovni toku, které změří mapování hodnotového toku. Skoro vždy v něm převažuje čekání, ne opracování. |
| Zásoby | |||
| Obrátka zásob | Kolikrát za rok se zásoba spotřebuje a doplní. | Obrátka = náklady na prodané zboží / průměrná hodnota zásob | Finanční pohled na to, kolik hotovosti provoz váže. |
| Zásoba ve dnech (DOH) | Na kolik dní by současná zásoba vystačila při současné spotřebě. | DOH = 365 / obrátka zásob (nebo množství na skladě / denní spotřeba) | Tentýž fakt jako obrátka, jen v provozních jednotkách. Funguje na materiál, na výrobní stupeň i na sklad. |
| Rozpracovaná výroba (WIP) | Kusy ležící mezi materiálem a hotovými výrobky, nejlépe vyjádřené ve dnech poptávky. | Dny WIP = kusy WIP / denní poptávka | Přímý hnací činitel průběžné doby. Strop na WIP je nejrychlejší páka na průběžnou dobu, jakou závod má. |
| Produktivita | |||
| OEE | Celková efektivnost zařízení: kolik z plánovaného času stroje vyrobí dobré kusy v ideálním taktu. | OEE = dostupnost x výkon x kvalita | Najde největší ze šesti ztrát na úzkém místě. Celý výpočet najdete v průvodci OEE. |
| Produktivita práce | Dobrý výstup na hodinu přímé práce. | Produktivita práce = vyrobené dobré kusy / hodiny přímé práce | Sleduje efekt zlepšení v trendu. Jako cíl na úrovni směny je riskantní, protože odměňuje nadprodukci. |
| Čas přetypování | Čas od posledního dobrého kusu výrobku A po první dobrý kus výrobku B v plné rychlosti. | Přetypování = čas prvního dobrého kusu B minus čas posledního dobrého kusu A | Páka, která rozhoduje o velikosti dávek i o flexibilitě. Téma metody SMED. |
| Neplánované prostoje | Plánovaný výrobní čas ztracený neplánovanými zastaveními. | Podíl prostojů = čas neplánovaných zastavení / plánovaný výrobní čas | Určuje priority údržby. Důvody zastavení zapisujte u stroje, ne až v měsíčním reportu. |
Dva z nich si zaslouží vlastní stránku a mají ji: OEE, kde tři faktory a šest velkých ztrát potřebují celý výpočet krok za krokem, a čas přetypování, jehož metodou zkracování je SMED. Průběžná doba a WIP se během týdne mapování hodnotového toku měří, neodhadují, a právě proto obě praktiky běží souběžně.
Jak vybrat vlastní KPI: šest pravidel výběru
Systém měření se vyhrává nebo prohrává při výběru. A výběr se navrhuje, nesbírá. Použijte tato pravidla popořadě na tabulku výše a sada pěti až osmi čísel na úrovni závodu z toho vypadne skoro mechanicky.
Vyjděte z úzkého místa a z obchodního problému
Seznam KPI se odvozuje, nesbírá. Pokud je obchodním problémem včasnost dodávek a úzkým místem obrobna, patří na seznam OTIF, OEE obrobny a čas přetypování, a tucet dalších věrohodných ukazatelů ne. KPI si své místo zaslouží tím, že se váže na to, co závod dnes brzdí.
Ke každému zpětnému ukazateli přidejte předstihový
Zpětná čísla (OTIF, TRIR, náklady na nekvalitu) říkají, jak měsíc dopadl. Předstihová čísla (dodržování plánu, hlášené skoronehody, výtěžnost na první pokus na úzkém místě) říkají, jak měsíc právě probíhá, dokud s tím ještě jde něco dělat. Přehled složený jen ze zpětných KPI je zpětné zrcátko.
Jeden jmenovitý vlastník na jedno KPI
Vlastník je jediný člověk, který číslo vysvětlí, ví, proč se pohnulo, a přinese protiopatření. KPI, které vlastní útvar, nevlastní nikdo. Jeden člověk může vlastnit několik KPI, žádné KPI nesmí mít dva vlastníky.
Nejdřív výchozí hodnota, teprve pak cíl
Měřte dva až čtyři týdny, než stanovíte jakýkoli cíl. Cíle stanovené dřív, než existuje výchozí hodnota, jsou vyjednaná fikce a lidé se naučí obcházet měření místo toho, aby zlepšovali proces.
Měřte na procesu, ne z reportů
Číslo na tabuli musí být spočitatelné tam, kde se pracuje: kusy, zastavení, minuty, vady. Výstupy z ERP a měsíční uzávěrky přicházejí pozdě a lidé je zpochybní. Číslo, které operátoři pomáhali počítat, je číslo, které přijmou.
Každé KPI potřebuje poradu, kde ho někdo přečte
Pojmenujte poradu, na které se každé KPI čte, a rozhodnutí, které podpírá: denní Tier porada u tabule, týdenní hodnocení výkonnosti, nebo měsíční přezkoumání vedením. Když poradu pojmenovat neumíte, je to KPI na ozdobu a patří pryč.
Výchozí měření, které lidé přijmou
Výchozí hodnota jsou dva až čtyři týdny poctivého měření, ještě než existuje jakýkoli cíl. Na pořadí záleží. Zaprvé definujte každé KPI písemně: vzorec, zdroj dat, pravidla počítání a hraniční případy, protože první spor u kterékoli tabule je vždycky o definici, ne o výkonu. Zadruhé měřte na procesu, a to tak, aby obsluha počítala s vámi nebo aspoň na to počítání viděla. Zatřetí ať každý vlastník své číslo přijme. Ne že se mu bude líbit, ale že ho uzná za pravdivé. Teprve potom stanovte cíle.
Počítejte s tím, že výchozí hodnoty budou horší, než všichni věřili. Vykazovaná čísla se léty tiché velkorysosti v definicích posouvají nahoru a měření na procesu tu velkorysost odstraní. OTIF, který spadne z vykazovaných 95 na naměřených 87, se nezhoršil. Stal se skutečným, a jen skutečná čísla se dají zlepšovat.
Ukázka: výběr šesti startovních KPI
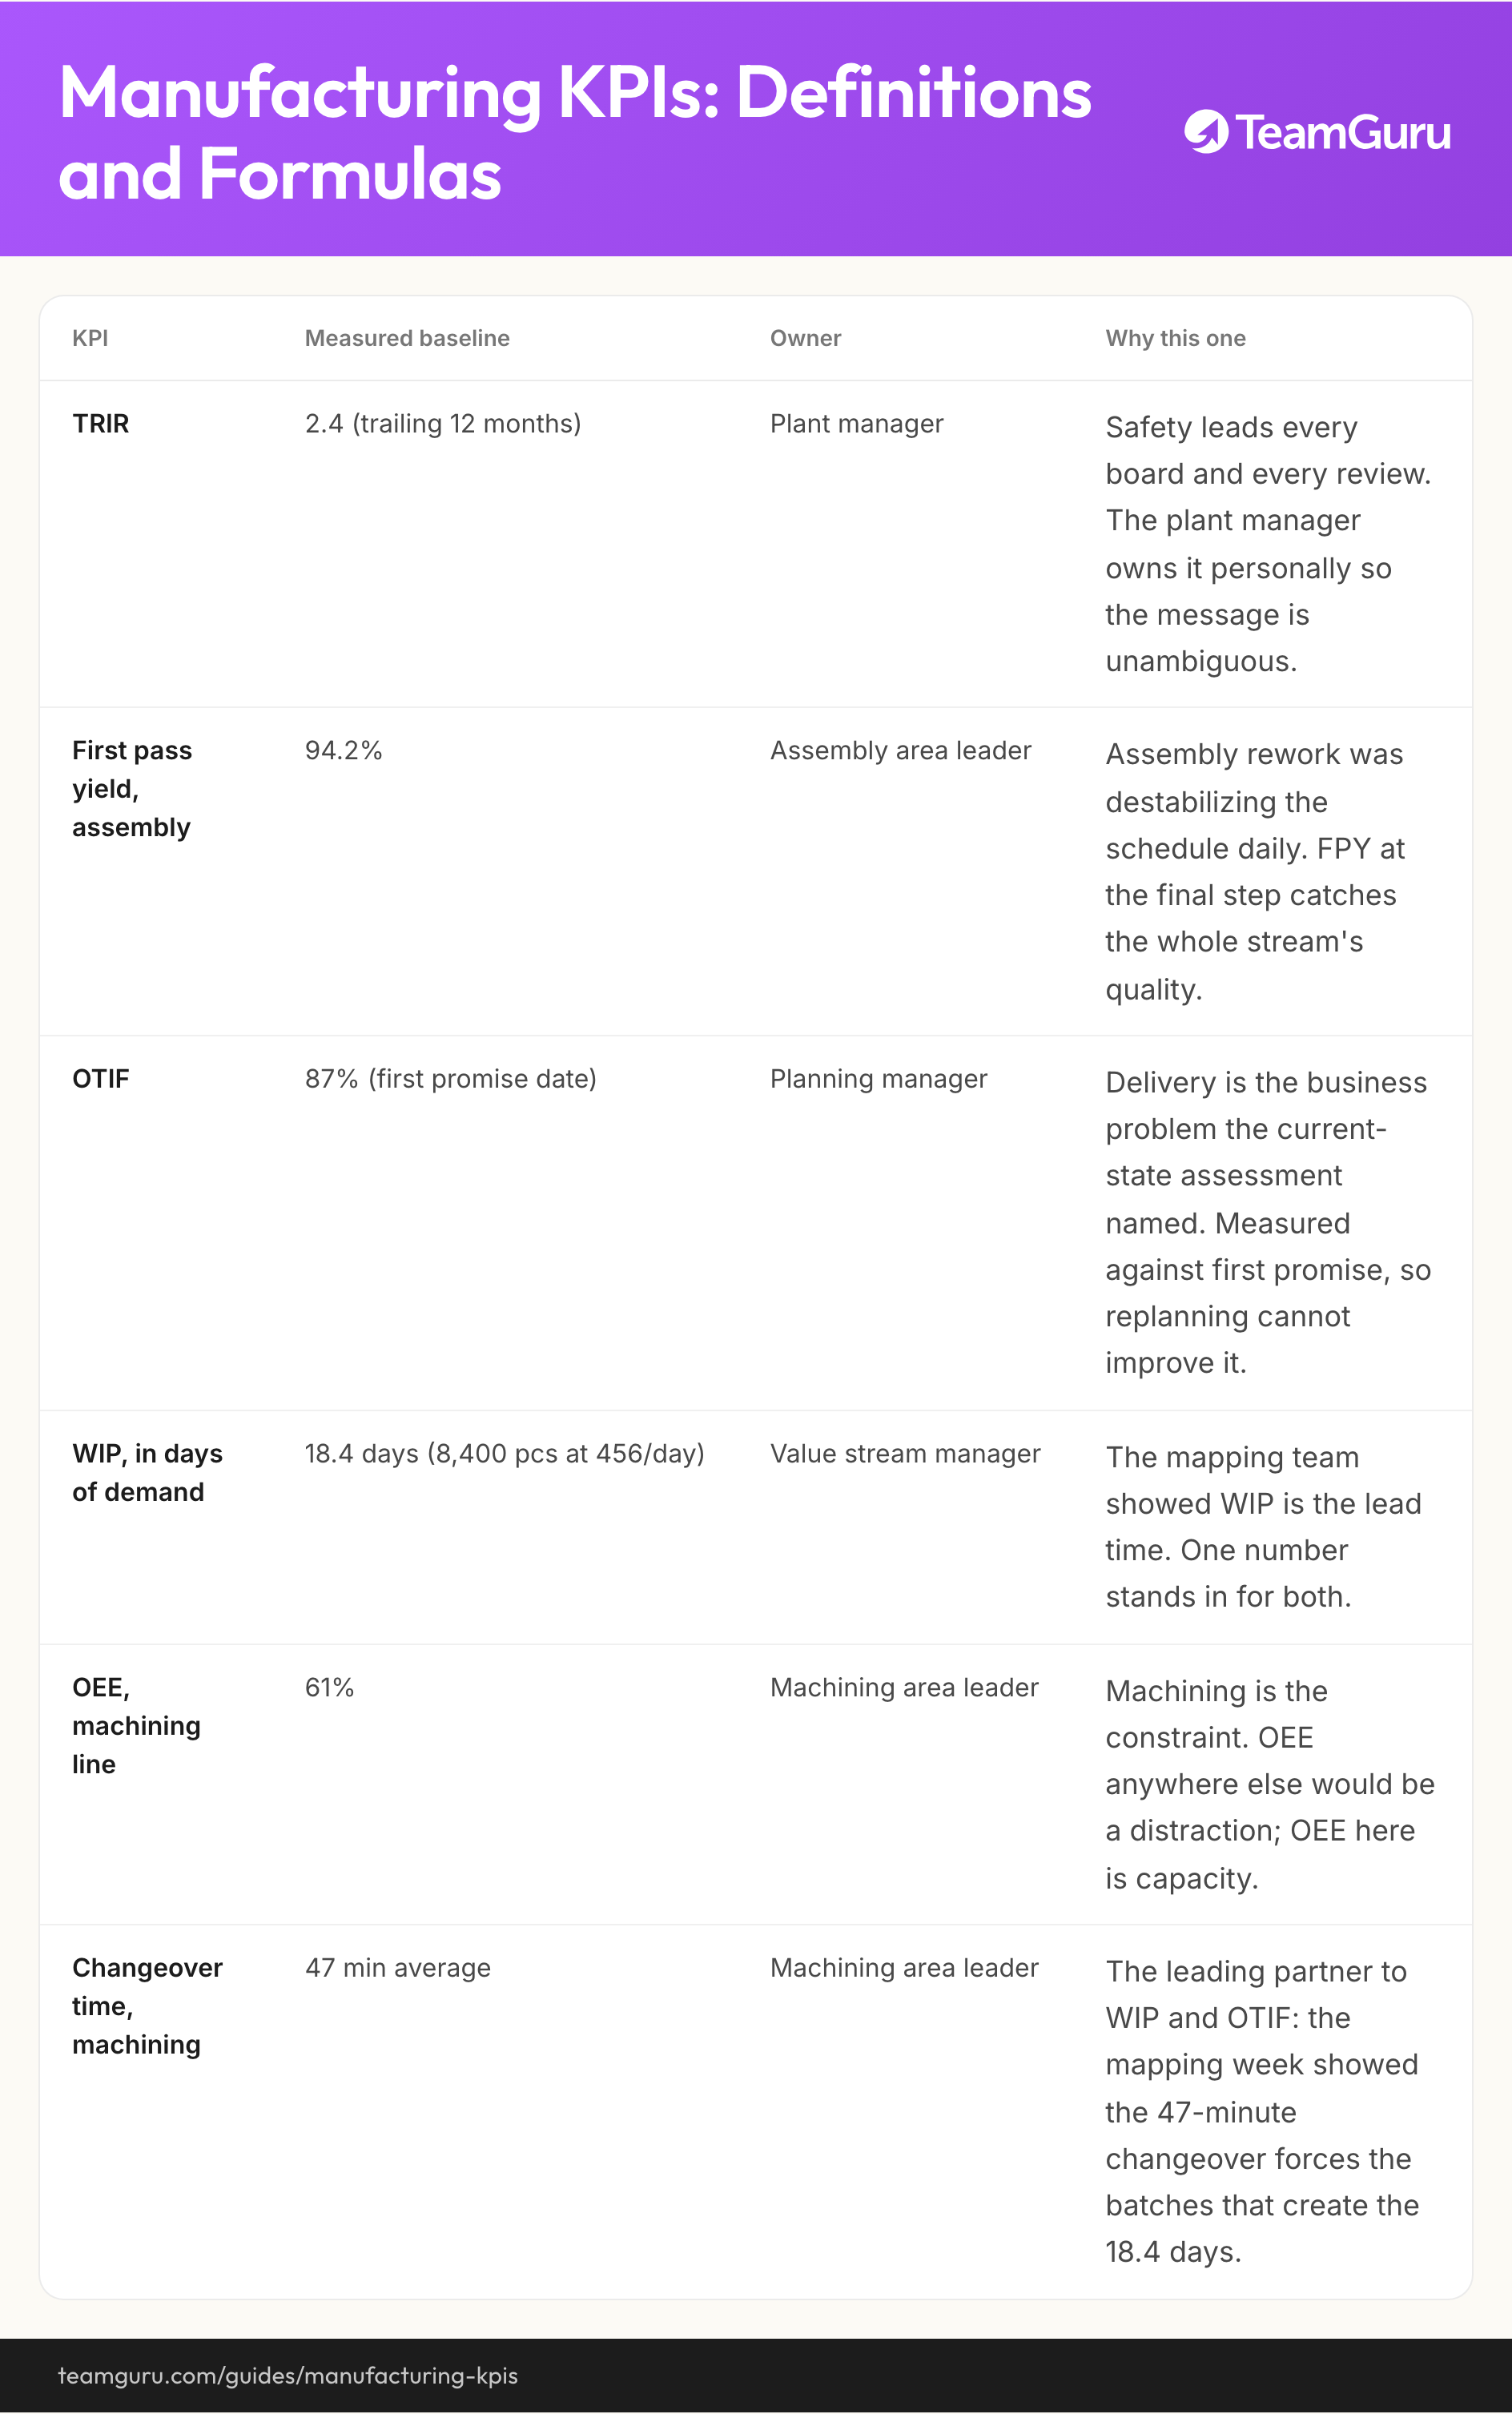
Čísla níže jsou ilustrativní, ale vnitřně konzistentní. Patří stejnému výrobci komponent se 450 zaměstnanci, který se používá napříč transformační roadmapou: poptávka 456 kusů denně na dvě směny, dodávky pojmenované jako obchodní problém, obrobna určená jako úzké místo a mapovací týden, který našel 8 400 kusů rozpracované výroby a 47minutové přetypování. Závod si vybral šest startovních KPI a každá volba se dá dohledat k některému pravidlu výběru:
| KPI | Naměřená výchozí hodnota | Vlastník | Proč právě toto |
|---|---|---|---|
| TRIR | 2,4 (klouzavých 12 měsíců) | Ředitel závodu | Bezpečnost je první na každé tabuli a na každé poradě. Ředitel závodu ji vlastní osobně, aby to sdělení bylo jednoznačné. |
| Výtěžnost na první pokus, montáž | 94,2 % | Vedoucí montáže | Opravy na montáži denně rozkolísávaly plán. FPY na posledním kroku zachytí kvalitu celého toku. |
| OTIF | 87 % (proti prvnímu příslibu) | Vedoucí plánování | Dodávky jsou obchodní problém, který pojmenovala analýza současného stavu. Měří se proti prvnímu příslibu, aby to přeplánování nemohlo vylepšit. |
| WIP ve dnech poptávky | 18,4 dne (8 400 kusů při 456 za den) | Manažer hodnotového toku | Mapovací tým ukázal, že WIP je průběžná doba. Jedno číslo zastane obojí. |
| OEE, obráběcí linka | 61 % | Vedoucí obrobny | Obrobna je úzké místo. OEE kdekoli jinde by rozptylovalo pozornost, OEE tady je kapacita. |
| Čas přetypování, obrobna | 47 min v průměru | Vedoucí obrobny | Předstihový partner k WIP a OTIF: mapovací týden ukázal, že 47minutové přetypování vynucuje dávky, ze kterých vzniká oněch 18,4 dne. |
Všimněte si, co na seznamu chybí. Žádná obrátka zásob, protože dny WIP nesou tentýž signál na úrovni, kde s ním manažer hodnotového toku umí něco udělat. Žádná produktivita práce, protože s dodávkami jako problémem by stahovala pozornost k tomu, aby stroje běžely naplno, a přesně tak vzniklo oněch 8 400 kusů rozpracované výroby. A zatím žádné cíle: ty přijdou přes nasazení strategie po čtyřech týdnech měření, aby první cíle vycházely z reality místo z přání.
Od čísel k řízení
Sada KPI se změřenými výchozími hodnotami je přístrojová deska, ne systém řízení. Systém z ní udělají tři praktiky. Zaprvé kaskádování: strom KPI spojí každé číslo závodu s čísly provozů a směn, které ho ženou, takže směna, která zlepšuje dodržování plánu, ví, že hýbe OTIF celého závodu. Zadruhé rytmus: čísla na úrovni směny jdou na SQDIP tabule, které se probírají v cyklu Shop Floor Managementu, kde se z červeného čísla do 24 hodin stane akce se jménem a termínem. Zatřetí eskalace nahoru: týdenní a měsíční porady pracují s trendy, na které denní cyklus sám nestačí.
Právě tady tabulky končí: definice se rozvětví do lokálních kopií, výchozí hodnoty se přepisují ručně a porady zase běží na číslech, kterým nikdo úplně nevěří. V TeamGuru žije každé KPI jen jednou, i se svou definicí, vlastníkem, výchozí hodnotou a historií, přes řízení KPI, a tabule i porady čtou z tohoto jednoho záznamu přes reporty, takže denní tabule, měsíční porada i telefon ředitele závodu ukazují stejné číslo.
V roadmapě jsou dalšími kroky nasazení strategie, které staví na výchozích hodnotách cíle a mění největší mezery v několik málo vlastněných priorit závodu, a denní řízení výroby, které ta čísla každé ráno zapojuje do práce.
Vezměte si s sebou
Diagram z tohoto průvodce jako obrázek, volně použitelný v interních školeních a workshopech.
Stáhnout PNGČasté otázky
Kolik KPI má výrobní závod mít?
Jaký je rozdíl mezi předstihovými a zpětnými KPI?
Jaký je rozdíl mezi KPI a metrikou?
Jak často se mají výrobní KPI přezkoumávat?
Jaký je dobrý benchmark pro včasnost dodávek?
Kdo má KPI vlastnit?
Jak to TeamGuru řeší v praxi