Průvodce zavedením
7 druhů plýtvání.
Sedm druhů plýtvání, zapamatovatelných zkratkou DOTWIMP nebo TIMWOOD, jsou vady, nadprodukce, doprava, čekání, nadbytečné zásoby, zbytečný pohyb a nadbytečné zpracování: sedm způsobů, jak proces spotřebovává čas a peníze, aniž by přidával hodnotu. Není to seznam úkolů, ale optika, kterou se plýtvání naučíte vidět. A jeden z nich rozhoduje: dokud leží zásoby, ostatní plýtvání nebolí, a proto se jejich snižování zdá nebezpečné a proto funguje.
Co je sedm druhů plýtvání
Lean definuje hodnotu třemi testy, všechny z pohledu zákazníka: zákazník by za daný krok zaplatil, krok fyzicky mění výrobek směrem k tomu, co bylo objednáno, a je udělaný napoprvé správně. Všechno ostatní, co spotřebovává čas, materiál, pohyb nebo pozornost, je plýtvání (7 wastes), v toyotovském slovníku muda. Taiichi Ohno toto plýtvání roztřídil do sedmi opakujících se kategorií, které si praxe dnes pamatuje pomůckou DOTWIMP z anglických slov defects, overproduction, transport, waiting, inventory, motion a processing: vady, nadprodukce, doprava, čekání, nadbytečné zásoby, zbytečný pohyb a nadbytečné zpracování. Týž seznam se učí i jako TIMWOOD, s dopravou na prvním místě a stejnými sedmi druhy v jiném pořadí.
Ten seznam není normativní rámec ani program zlepšování. Je to způsob, jak se dívat. Nezacvičené oko míjí plýtvání každý den, protože plýtvání se převléká za práci: vysokozdvižný vozík přejíždějící halu vypadá vytíženě, plný paletový regál vypadá jako jistota, běžící stroj vypadá jako produktivita. Jakmile tým umí sedm kategorií pojmenovat, tatáž procházka toutéž halou ukáže jinou budovu.
Muda má i dva sourozence, o kterých se mluví méně a záleží na nich víc: mura, tedy nerovnoměrnost, a muri, tedy přetěžování. Velká část muda, kterou najdete, z nich vychází. Plán, který se týden od týdne prudce mění, si vynutí zásobníky, přesčasy a čekání; stroj nebo člověk zatížený nad rozumnou kapacitu produkuje poruchy a vady. Lovit plýtvání kus po kuse, zatímco plán zůstává rozkolísaný, je jako vytírat podlahu s puštěným kohoutkem. Tato stránka se soustředí na sedmičku, ale diagnostika, která mura a muri ignoruje, si polovinu toho, co vidí, přečte špatně.
Kam tato optika patří v roadmapě
V roadmapě zavedení TeamGuru patří sedm druhů plýtvání do analýzy současného stavu, tedy na samotný začátek fáze Diagnóza. Jsou optikou, na které celá fáze stojí: gemba walky si z nich berou téma, analýza z nich sestavuje rozbor ztrát a mapování hodnotového toku ty největší převádí do změřeného obrazu toku. Nejdřív se naučte vidět, pak měřte, pak vybírejte priority.
- Jste zde Analýza současného stavu
- Souběžně Mapování hodnotového toku
- Souběžně Výchozí KPI
- Potom Nasazení strategie
Proč jsou zásoby hlavní plýtvání
Klasické učení říká, že nejhorší ze sedmi je nadprodukce, protože vyrábí zbývajících šest. A má pravdu. Vyrobte víc, než navazující proces potřebuje, nebo to vyrobte dřív, a přebytek se musí převážet, skladovat, počítat a financovat, obcházet a prohledávat. A když se uvnitř hromady konečně objeví vada, objeví se týdny po tom, co vznikla, se stopou dávno vychladlou.
Nadprodukci je ale těžké chytit při činu, protože ve chvíli, kdy se děje, vypadá ctnostně. Běžící stroj vypadá užitečně; operátor v předstihu je dobrý operátor. Co po sobě nadprodukce nechává, se dá spočítat: zásoby. Zásoby jsou viditelným dvojčetem nadprodukce, usazeninou každého protlačeného plánu a každé předimenzované dávky. Právě proto se diagnostika začíná u nich.
Zásoby hrají ještě hlubší roli: díky nim ostatní druhy plýtvání nebolí. Se šestidenní hromadou polotovarů před obráběním nestojí porucha dnes nic. 47minutové přetypování nikoho neruší. Špatná dávka z předchozího procesu se najde o šest dní později, kdy jsou důkazy studené a spor neobhajitelný. Každá hromada mezi dvěma procesy je pojistka proti problémům, které pak nikdo není nucen řešit. Platíte za ni denně: v hotovosti, ploše a průběžné době.
Proto se snižování zásob zdá nebezpečné: skutečně odebírá pojistku a skryté problémy rychle vyplavou. A přesně proto funguje. Snižujte hladinu záměrně, po jednom zásobníku, s kapacitou na řešení problémů v pohotovosti, a závod vám řekne, co je doopravdy špatně, rychleji než jakýkoli audit. Ten nepříjemný pocit není vedlejší účinek metody. Je to ta metoda.
Sedm druhů plýtvání s příklady
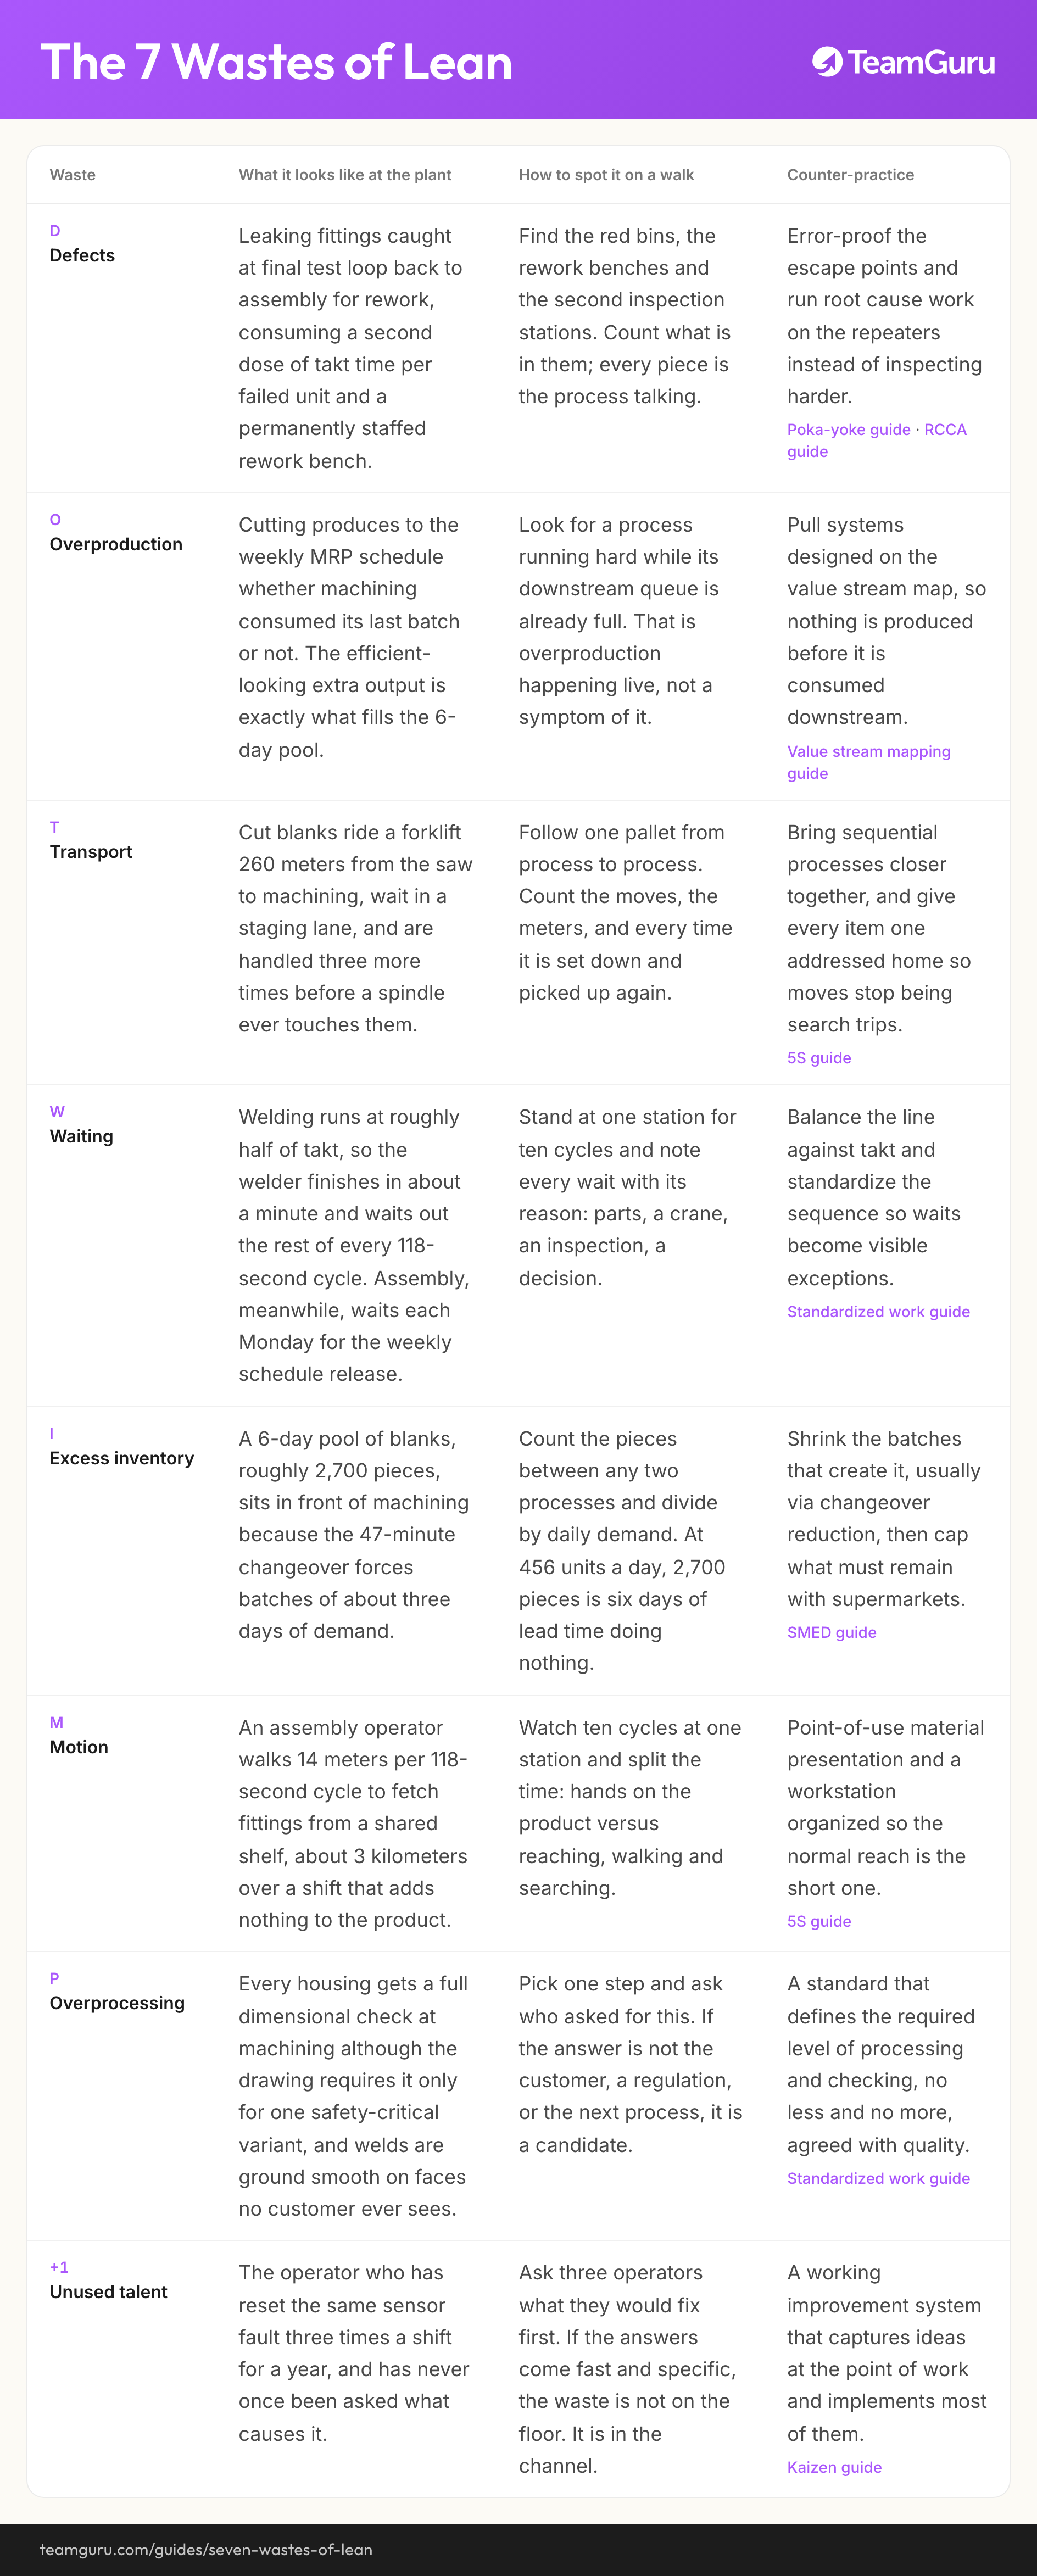
Tabulka prochází všech sedm v pořadí DOTWIMP, plus běžně doplňovaný osmý, na ilustrativním výrobci komponent se 450 lidmi, který se v těchto průvodcích používá: 456 kusů denně přes dělení materiálu, obrábění, svařování a montáž, dvě směny, 54 000 sekund denního pracovního času, takt 118 sekund. Čísla jsou ilustrativní, ale vnitřně konzistentní s průvodcem mapováním hodnotového toku, který mapuje tentýž závod.
| Plýtvání | Jak vypadá v závodě | Jak ho poznáte na procházce | Protiopatření |
|---|---|---|---|
| Vady | Netěsná šroubení zachycená na finální zkoušce se vracejí zpět na montáž k opravě, spotřebují druhou dávku taktu na každý vadný kus a trvale obsazený opravárenský stůl. | Najděte červené bedny, opravárenské stoly a druhá kontrolní stanoviště. Spočítejte, co v nich leží; každý kus je zpráva o procesu. | Zabezpečte místa úniku proti chybě a u opakovaných vad pracujte na kořenové příčině, místo abyste kontrolovali přísněji. průvodce Poka-Yoke průvodce analýzou kořenových příčin |
| Nadprodukce | Dělení materiálu vyrábí podle týdenního plánu z MRP bez ohledu na to, jestli obrábění spotřebovalo poslední dávku. Přebytek, který vypadá jako vysoká efektivita, je přesně to, co plní šestidenní hromadu. | Hledejte proces, který jede naplno, zatímco fronta za ním je už plná. To je nadprodukce přímo při činu, ne její příznak. | Tahové systémy navržené podle mapy hodnotového toku, aby se nic nevyrobilo dřív, než to navazující proces spotřebuje. průvodce mapováním hodnotového toku |
| Doprava | Nařezané polotovary jedou 260 metrů vysokozdvižným vozíkem od pily k obrábění, čekají v odkládací uličce a projdou ještě třemi manipulacemi, než se jich vůbec dotkne vřeteno. | Sledujte jednu paletu od procesu k procesu. Spočítejte přesuny, metry a každé odložení a opětovné zvednutí. | Přibližte navazující procesy k sobě a dejte každé položce jedno adresné místo, aby se z přesunů přestalo stávat hledání. průvodce 5S |
| Čekání | Svařování jede zhruba na polovinu taktu, svářeč je hotový asi za minutu a zbytek každého 118sekundového cyklu čeká. Montáž zase každé pondělí čeká na uvolnění týdenního plánu. | Postavte se na jedno pracoviště na deset cyklů a zapište každé čekání i s důvodem: díly, jeřáb, kontrola, rozhodnutí. | Vyvažte linku na takt a standardizujte sled operací, aby se z čekání staly viditelné výjimky. průvodce standardizovanou prací |
| Nadbytečné zásoby | Šestidenní hromada polotovarů, zhruba 2 700 kusů, leží před obráběním, protože 47minutové přetypování vynucuje dávky asi na tři dny poptávky. | Spočítejte kusy mezi dvěma procesy a vydělte je denní poptávkou. Při 456 kusech denně je 2 700 kusů šest dní průběžné doby, které nic nedělají. | Zmenšete dávky, které zásobu vytvářejí, obvykle zkrácením přetypování, a zbytek, který musí zůstat, zastropujte supermarkety. průvodce SMED |
| Zbytečný pohyb | Operátor montáže ujde na každý 118sekundový cyklus 14 metrů pro šroubení do sdíleného regálu, za směnu zhruba 3 kilometry, které výrobku nic nepřidají. | Sledujte deset cyklů na jednom pracovišti a rozdělte čas: ruce na výrobku proti sahání, chůzi a hledání. | Materiál připravený v místě spotřeby a pracoviště uspořádané tak, aby běžný dosah byl ten krátký. průvodce 5S |
| Nadbytečné zpracování | Každá skříň projde na obrábění plnou rozměrovou kontrolou, ačkoli výkres ji požaduje jen u jedné bezpečnostně kritické varianty, a svary se brousí dohladka na plochách, které žádný zákazník nikdy neuvidí. | Vyberte jeden krok a zeptejte se, kdo si ho vyžádal. Pokud odpověď není zákazník, předpis nebo navazující proces, je to kandidát. | Standard dohodnutý s kvalitou, který určuje požadovanou míru zpracování a kontroly, ne méně a ne více. průvodce standardizovanou prací |
| Nevyužitý potenciál | Operátor, který rok resetuje třikrát za směnu tutéž poruchu čidla a ani jednou nedostal otázku, čím je způsobená. | Zeptejte se tří operátorů, co by opravili jako první. Když odpovědi přijdou rychle a konkrétně, plýtvání není ve výrobě. Je v tom, kudy se nápady dostávají dál. | Funkční systém zlepšování, který sbírá nápady přímo v místě práce a většinu z nich také realizuje. průvodce kaizenem |
Osmý řádek je pozdější doplněk kánonu a své místo si zaslouží. Závod, který se svých operátorů nikdy nezeptá, co vidí, nechává své nejlevnější a nejlépe umístěné senzory odpojené.
Jak vést procházku za plýtváním
Procházka za plýtváním je tematický gemba walk: 30 minut, přímo u procesu, a nesete si z ní čísla a citace, ne dojmy. List níže dává deset pozorovatelných otázek. Nezkoušejte v jedné procházce všech deset: vyberte tři nebo čtyři, jděte ve dvou a shodněte se na tom, co jste oba viděli, dřív než cokoli zapíšete.
| # | Otázka | Co odhalí |
|---|---|---|
| Spočítejte kusy ležící mezi dvěma pracovišti a vydělte je denní poptávkou, aby se z hromady staly hodiny nebo dny. | Nadbytečné zásoby | |
| Změřte jednoho operátora po deset cyklů: ruce na výrobku proti chůzi, sahání a hledání. | Zbytečný pohyb | |
| Najděte v mezioperační zóně nejstarší datum, na štítku, v průvodní dokumentaci nebo v prachu, a zeptejte se, proč tam ten díl pořád je. | Nadbytečné zásoby, často i vady | |
| Postavte se na jedno pracoviště na deset celých cyklů a zapište každé čekání i s důvodem: díly, jeřáb, kontrola, rozhodnutí, informace. | Čekání | |
| Sledujte jednu paletu od jednoho procesu k dalšímu. Spočítejte přesuny, metry a odložení. | Doprava | |
| Najděte proces, který běží, přestože fronta za ním je plná, a zeptejte se, co má operátor dělat, když se fronta zaplní. | Nadprodukce | |
| Najděte opravárenský stůl a červené bedny. Spočítejte obsah a přečtěte si štítky s vadami. | Vady | |
| Vyberte jeden krok zpracování nebo kontroly a zeptejte se, kdo ho vyžaduje: zákazník, předpis, navazující proces, nebo zvyk. | Nadbytečné zpracování | |
| Sledujte jedno přetypování od začátku do konce, nebo se zeptejte, kdy bylo poslední a jak dlouho trvalo. | Logika dávek za zásobami | |
| Zeptejte se jednoho operátora, co by změnil jako první, a odpověď si zapište doslova. | Nevyužitý potenciál |
Tři pravidla, která udrží procházku poctivou
- Plýtvání jsou příznaky, takže každé z nich dovedete k systémové příčině dřív, než cokoli navrhnete: doprava ukazuje na rozmístění, zásoby na logiku dávek a přetypování, čekání na nevyváženost linky, vady na řízení procesu.
- Zkoumejte proces, nikdy člověka. Operátor, který za směnu ujde tři kilometry, si pracoviště nenavrhl, a parta na dělení materiálu, která staví hromadu, plní plán, který dostala.
- Nespouštějte sedm tažení najednou. Procházka je vstupem do diagnostiky; kam půjde úsilí na zlepšování, rozhoduje diagnostika, ne procházka.
V roadmapě tohle všechno patří do fáze Diagnóza: pozorování z procházek spolu se změřenými KPI a mapou hodnotového toku tvoří jeden sdílený obraz toho, kde závod ztrácí čas a peníze.
Od pozorování k akci
Pozorování začne být užitečné ve chvíli, kdy dostane hrubé číslo. 2 700 kusů před obráběním je šest dní průběžné doby a šest dní peněz. 14 metrů chůze na cyklus je zhruba půl hodiny z každé směny operátora. Opravárenský stůl s třiceti kusy je denní dávka vad zviditelněná na jednom místě. Kvantifikujte v hodinách, kusech a metrech, ne ve filozofii, a smiřte se s hrubostí: dnešní počet udělaný u procesu je lepší než přesná statistika za minulý měsíc.
Ve fázi Diagnóza se tyto veličiny sečtou do rozboru ztrát: dva nebo tři největší zdroje ztrát, hrubě naceněné, se stanou důvodem ke změně a užším seznamem, který pak do hloubky rozebere mapování hodnotového toku a výchozí KPI. Později, až bude existovat rytmus denního řízení, se z téže optiky stane trvalý zdroj nápadů na zlepšení, protože každý, kdo umí druhy plýtvání pojmenovat, je vidí na svém vlastním pracovišti.
Zjištění tak jako tak potřebují místo, kde se jich někdo ujme. Pozorování z procházky, které umře v zápisníku, naučí lidi přestat říkat, co vidí. V TeamGuru se ze zjištění z procházky stávají akce s vlastníkem a termínem a nápady na zlepšení vstupují do jedné kaizen fronty s viditelným stavem, takže po procházce zůstane stopa, ne vzpomínka.
Časté chyby
Jak vypadá špatná praxe
- Turistika za plýtváním: den fotek, prezentace, žádný vlastník, žádné pokračování
- Operátoři obviňovaní z plýtvání, které jim vnucuje systém: z chůze, z čekání, z dávek
- Hon na nadbytečné zpracování, který zruší skutečné kroky kvality, protože kontrola vypadala z kanceláře zbytečně
- Sedm tažení spuštěných najednou po jedné nadšené procházce
- Procenta plýtvání vyhlášená ze systému ERP, která nikdo neověřil u procesu
Jak vypadá dobrá praxe
- Tematické procházky: jeden druh plýtvání, 30 minut, u procesu, ve dvou
- Zjištění kvantifikovaná ještě tentýž den v kusech, hodinách a metrech
- Každé pozorování dovedené k systémové příčině dřív než k jakémukoli opatření
- Dvě nebo tři největší ztráty vstupují do analýzy a do mapy hodnotového toku
- Operátoři dotázaní, co jim překáží, a poděkování za odpověď
Co následuje
Sedm druhů plýtvání je začátek diagnostiky, ne celá diagnostika. To, co procházky vynesou na povrch, míří do dvou tvrdších nástrojů: mapování hodnotového toku, které největší plýtvání promění ve změřený obraz toku s budoucím stavem a plánem zlepšení, a výchozích KPI, díky kterým je vidět, jak se ztráty vyvíjejí týden po týdnu, místo aby žily v paměti jednoho workshopu.
Odtud roadmapa pokračuje k nasazení strategie, kde největší vyčíslené ztráty soutěží o místo mezi několika skutečnými prioritami závodu. Tým, který se naučil své plýtvání vidět, spočítal ho a zatím na všechno nedokáže reagovat, udělal tuto fázi správně. Vidět je první krok; systém, který podle toho jedná, je zbytek roadmapy.
Vezměte si s sebou
Diagram z tohoto průvodce jako obrázek, volně použitelný v interních školeních a workshopech.
Stáhnout PNGČasté otázky
Co znamená zkratka DOTWIMP?
Co je osmý druh plýtvání?
Co jsou muda, mura a muri?
Který druh plýtvání máme řešit jako první?
Dají se odstranit všechny činnosti, které nepřidávají hodnotu?
Jak se plýtvání měří?
Jak to TeamGuru řeší v praxi