Implementation Guide
Manufacturing KPIs and Metrics.
Manufacturing KPIs are the measured numbers a plant runs itself by, usually grouped as safety, quality, delivery, inventory and productivity (SQDIP). The KPIs that matter share three properties: they are measured at the process, one named person owns each number, and each number informs a decision in a regular review. Measure a few numbers that someone owns, not many numbers that nobody owns. A KPI without an owner and a decision is reporting, not management. The table below defines 32 common KPIs with formulas and the meeting where each one belongs.
What manufacturing KPIs are for
A manufacturing KPI exists to inform a decision. That is the whole job. OTIF at 87 percent is not information until someone owns the number, knows why it is 87 and not 94, and uses it in a review to decide where the next countermeasure goes. Everything else that gets measured, and plants measure a great deal, is a metric: potentially useful, occasionally consulted, but not the basis on which the plant is run.
The useful mental model is a small hierarchy. At the top sit five to eight plant-level KPIs, conventionally grouped as safety, quality, delivery, inventory and productivity, the SQDIP structure that also organizes daily boards. Below them, each area or line carries its own three to five numbers that its shift can actually influence. Below that live all the metrics the systems record anyway. The failure mode is flattening this hierarchy into one 40-line scorecard where everything is equally important, which means nothing is.
Scope note: this page defines the core KPIs, gives their formulas, and shows how to select a starting set and baseline it. The SQDIP guide covers the daily board built from these numbers, the OEE guide goes deep on equipment effectiveness, and the KPI tree guide covers cascading plant KPIs down to shift level.
Where KPIs sit in the transformation roadmap
On the TeamGuru deployment roadmap this topic is the Baseline KPIs practice in the Diagnose stage. It follows the current-state assessment, which names the business problem the KPIs must serve, and runs in parallel with value stream mapping, which supplies measured numbers like lead time, WIP and changeover. The baseline then feeds strategy deployment, which sets targets on it, and daily management, which reviews it every day.
- Before Current-State Assessment
- You are here Baseline KPIs
- In parallel Value Stream Mapping
- After Strategy Deployment
- After Daily Management
When more KPIs make things worse
Measurement feels like progress, which is exactly why it gets overdone. Every number added to a scorecard costs attention, and attention is the scarcest resource in a plant. Before adding a KPI, check the list below; most struggling measurement systems fail in one of these four ways, and none of them is fixed by measuring more.
- The 40-metric scorecard. Nobody can name the owner of line 23, reviews skim instead of decide, and the three numbers that matter drown in the 37 that do not. If the monthly review cannot discuss every KPI, the list is too long, not the meeting too short.
- Averages that hide variation. A monthly OTIF of 91 percent can contain one perfect week and one disastrous one, and the disaster is where the learning is. Review trends and distributions at the working level; reserve single averaged numbers for summaries.
- Vanity metrics. Units produced looks great on a wall and rewards overproduction, the worst of the seven wastes. Any output number without a demand, quality or time denominator flatters effort instead of measuring performance.
- KPIs nobody can influence on shift level. Inventory turns on a production cell's board is noise: the team cannot move it from their station. Cascade instead: the cell tracks schedule adherence and FPY, and those roll up into the turns the plant manager owns.
32 manufacturing KPIs with formulas
These 32 KPIs cover what most plants genuinely need to choose from: the five SQDIP groups, plus maintenance, cost and people. Formulas are written in plain language on purpose: if a number cannot be explained at the board in one line, it will not survive on the shop floor. The tag under each name says where the KPI is usually read: at the daily tier 1 board, in the weekly review or in the monthly management review. No plant should track all 32. Pick a starting set with the rules in the next section.
| KPI | Definition | Formula | Typical use |
|---|---|---|---|
| Safety | |||
| TRIR Monthly review | Total recordable incident rate: recordable injuries and illnesses normalized to 100 full-time workers per year. The standard lagging safety measure. | TRIR = (recordable incidents x 200,000) / total hours worked | Comparing safety performance across sites and over time. The 200,000 constant is 100 workers times 2,000 hours. |
| DART rate Monthly review | Days away, restricted or transferred: the recordable cases serious enough to keep someone off their normal job, on the same 200,000-hour basis. | DART = (DART cases x 200,000) / total hours worked | Separating serious injuries from minor recordables, which TRIR mixes together. |
| Near-miss reporting rate Daily, tier 1 board | How many near misses and unsafe conditions people report per period. A leading indicator: a rising count usually means growing trust, not growing danger. | Near misses reported per month (often per 100 employees) | Judging whether the safety system finds problems before they become injuries. |
| Quality | |||
| First pass yield (FPY) Daily, tier 1 board | Share of units that pass one process step correctly the first time, with no rework, repair or scrap. | FPY = units passing first time / units started | The most honest single quality number for one process step, because it counts rework that scrap rate hides. |
| Rolled throughput yield (RTY) Weekly review | Probability that a unit passes every step of the whole stream first time: the product of all step FPYs. | RTY = FPY step 1 x FPY step 2 x ... x FPY step n | Exposing the hidden factory. Five steps at 97 percent each give an RTY of only 86 percent. |
| Scrap rate Daily, tier 1 board | Share of started units (or production cost) lost as scrap. | Scrap rate = scrapped units / units started | Sizing the material loss. Pair it with FPY, which also captures the rework scrap rate misses. |
| PPM defect rate Monthly review | Defective parts per million units delivered to the customer. | PPM = (defective units / units delivered) x 1,000,000 | Customer-facing quality, the number that appears on supplier scorecards. |
| Customer complaints Weekly review | Formal complaints and returns received from customers in a period, counted once per issue, not per part. | Complaints per month (or per million units shipped) | The earliest customer signal, weeks before it shows up in PPM. Each one should open a problem-solving case. |
| Incoming supplier PPM Monthly review | Defective purchased parts per million received, found at incoming inspection or on the line. | Supplier PPM = (rejected parts / parts received) x 1,000,000 | Ranking suppliers and deciding where a supplier 8D or development visit pays off. |
| Cost of poor quality (COPQ) Monthly review | All money spent because things are not right first time: scrap, rework, warranty, returns and excess inspection. | COPQ % = (scrap + rework + warranty + inspection cost) / sales | Translating quality into money for prioritization and the monthly management review. |
| Delivery | |||
| On-time delivery (OTD / OTIF) Weekly review | Share of customer orders delivered on the promised date. OTIF adds: in full and correct. | OTIF = orders delivered on time and in full / total orders | The customer's view of delivery. Measure against the first promise date, not the latest reschedule. |
| Schedule adherence Daily, tier 1 board | How closely production followed the plan for a given interval, in quantity and sequence. | Schedule adherence = units produced to plan / units planned | Separating delivery misses caused by planning from misses caused by execution. |
| Throughput Daily, tier 1 board | Good units completed per period at the end of a line or stream. | Throughput = good units produced / time period | Checking that the line keeps pace with demand. Count good units only, or it rewards making scrap faster. |
| Cycle time vs takt time Daily, tier 1 board | Cycle time is how long one unit takes at a step; takt time is the pace demand requires: available time divided by customer demand. | Takt = available time / customer demand; compare with measured cycle time per step | Finding the step that cannot keep up. Any step slower than takt is a bottleneck in waiting. |
| Lead time Monthly review | Elapsed time from order to delivery, or from material entering the plant to leaving the dock. Queues included. | Lead time = delivery date minus order date (or dock-to-dock days) | The stream-level number a value stream map measures. Almost always dominated by waiting, not processing. |
| Inventory | |||
| Inventory turns Monthly review | How many times per year the inventory is consumed and replaced. | Turns = cost of goods sold / average inventory value | The finance-level view of how much cash the operation ties up. |
| Days on hand (DOH) Weekly review | How many days current inventory would last at current consumption. | DOH = 365 / inventory turns (or on-hand quantity / daily usage) | The same fact as turns in operational units. Works per material, per stage and per warehouse. |
| Work in process (WIP) Daily, tier 1 board | Units sitting between raw material and finished goods, best expressed in days of demand. | WIP days = WIP units / daily demand | The direct driver of lead time. Capping WIP is the fastest lead time lever a plant has. |
| Inventory accuracy Monthly review | Share of counted locations or items where the system quantity matches the physical count. | Accuracy = locations counted correct / locations counted | Making every other inventory number trustworthy. Planning on 90 percent accurate data plans shortages. |
| Productivity | |||
| OEE Daily, tier 1 board | Overall equipment effectiveness: how much of scheduled equipment time produces good parts at the ideal rate. | OEE = availability x performance x quality | Finding the biggest of the six losses on constraint equipment. See the OEE guide for the full calculation. |
| Labor productivity Weekly review | Good output per hour of direct labor. | Labor productivity = good units produced / direct labor hours | Trending the effect of improvements. Risky as a shift-level target, because it rewards overproduction. |
| Changeover time Daily, tier 1 board | Time from the last good unit of product A to the first good unit of product B at full rate. | Changeover = first good B unit time minus last good A unit time | The lever behind batch sizes and flexibility, and the subject of SMED. |
| Unplanned downtime Daily, tier 1 board | Scheduled production time lost to unplanned stops. | Downtime % = unplanned stop time / scheduled production time | Feeding maintenance priorities. Record stop reasons at the machine, not in a monthly report. |
| Maintenance | |||
| MTBF Monthly review | Mean time between failures: average running time between breakdowns of a machine. | MTBF = operating time / number of failures | Showing whether reliability work is paying off. Track it on the constraint and the few machines that stop most. |
| MTTR Weekly review | Mean time to repair: average time from a breakdown to the machine running again. | MTTR = total repair time / number of repairs | Finding where repairs wait: for a technician, a spare part or a decision. Waiting is usually most of it. |
| Planned maintenance compliance Weekly review | Share of preventive maintenance tasks done within their scheduled window. | PM compliance = PM tasks done on time / PM tasks scheduled | The leading partner to MTBF. Skipped PM shows up as breakdowns a few weeks later. |
| Cost | |||
| Manufacturing cost per unit Monthly review | Total cost of producing one good unit: material, labor and overhead. | Cost per unit = total manufacturing cost / good units produced | Connecting operational gains to the P&L. Read it as a trend; allocation rules make single months noisy. |
| Overtime Weekly review | Overtime hours as a share of regular hours. | Overtime % = overtime hours / regular hours worked | An early sign that capacity, absence or downtime is out of balance, long before it hits cost per unit. |
| Energy per unit Monthly review | Energy used to produce one good unit, in kWh or energy cost. | Energy per unit = energy consumed / good units produced | Making energy a production number instead of a utility bill, and tracking sustainability targets. |
| People | |||
| Absenteeism rate Daily, tier 1 board | Unplanned absence as a share of scheduled working time. | Absenteeism = unplanned absence hours / scheduled hours | Explaining why the plan broke today. At the board it is a headcount; in the review it is a trend. |
| Skills coverage Weekly review | Share of stations or skills that have at least the required number of qualified people, per shift. | Coverage = skills with enough qualified people / skills required | Knowing before the shift starts whether absence will stop a station. The skills matrix shows the gaps. |
| Employee turnover Monthly review | People who left as a share of average headcount, usually annualized. | Turnover = leavers in period / average headcount | The cost behind training, quality and safety problems. New people make most of the first-week mistakes. |
Two of these deserve their own pages and have them: OEE, where the three factors and the six losses need a full walkthrough, and changeover time, where the reduction method is SMED. Lead time and WIP are measured, not estimated, during a value stream mapping week, which is why the two practices run in parallel. The groups beyond SQDIP follow the same logic as the KPIs in ISO 22400, the standard for manufacturing operations KPIs: each number has a defined formula, a unit and a direction, so two plants that use the same name mean the same thing.
Free manufacturing KPI list (Excel)
All 32 KPIs from the table in one sheet: definition, formula, unit, which direction is better and where it is reviewed. Yellow columns for the plant to fill in: use it or not, one owner, the data source, the baseline and the target. A second sheet walks through the selection rules.
Download the KPI list (.xlsx)Free, no email needed. Opens in Excel, or in Google Sheets through File, Import. For the daily board built from these numbers, try the free SQDIP board template. Choosing a tool? See KPI dashboard software, compared.
How to choose your KPIs: six selection rules
Selection is where measurement systems are won or lost, and it is a design activity, not a collection activity. Apply these rules in order to the table above and a plant-level set of five to eight numbers falls out almost mechanically.
Start from the constraint and the business problem
The KPI list is derived, not collected. If delivery is the business problem and machining is the constraint, then OTIF, machining OEE and changeover time belong on the list, and a dozen plausible others do not. A KPI earns its place by connecting to what limits the plant today.
Pair every lagging KPI with a leading one
Lagging numbers (OTIF, TRIR, COPQ) tell you how the month went. Leading numbers (schedule adherence, near-miss reports, first pass yield at the constraint) tell you how the month is going while you can still act. A scorecard of only lagging KPIs is a rearview mirror.
One named owner per KPI
An owner is the single person who explains the number, knows why it moved and brings the countermeasure. A KPI owned by a department is owned by nobody. One person can own several KPIs; no KPI can have two owners.
Baseline before target
Measure for two to four weeks before setting any target. Targets set before the baseline exists are negotiated fiction, and people learn to game the measurement instead of improving the process.
Measure at the process, not from reports
The number on the board must be countable where the work happens: units, stops, minutes, defects. ERP extracts and month-end reconciliations come too late and get argued with. A number the operators helped count is a number they accept.
Every KPI needs a review where someone reads it
Name the meeting where each KPI is read and the decision it informs: the daily tier board, the weekly performance review or the monthly management review. If you cannot name the meeting, the KPI is decoration and should be cut.
Building a baseline people accept
A baseline is two to four weeks of honest measurement before any target exists. The sequence matters. First, define each KPI in writing: the formula, the data source, the counting rules and the edge cases, because the first argument at any board is always about the definition, not the performance. Second, measure at the process, with the people who run it counting or at least seeing the counts. Third, have each owner accept the number: not like it, accept it as true. Only then set targets.
Expect the baseline to be worse than everyone believed. Reported numbers drift upward over years of quiet definitional generosity, and measuring at the process removes the generosity. An OTIF that drops from a reported 95 to a measured 87 has not gotten worse; it has become real, and real numbers are the only ones that can improve.
Worked example: picking six starting KPIs
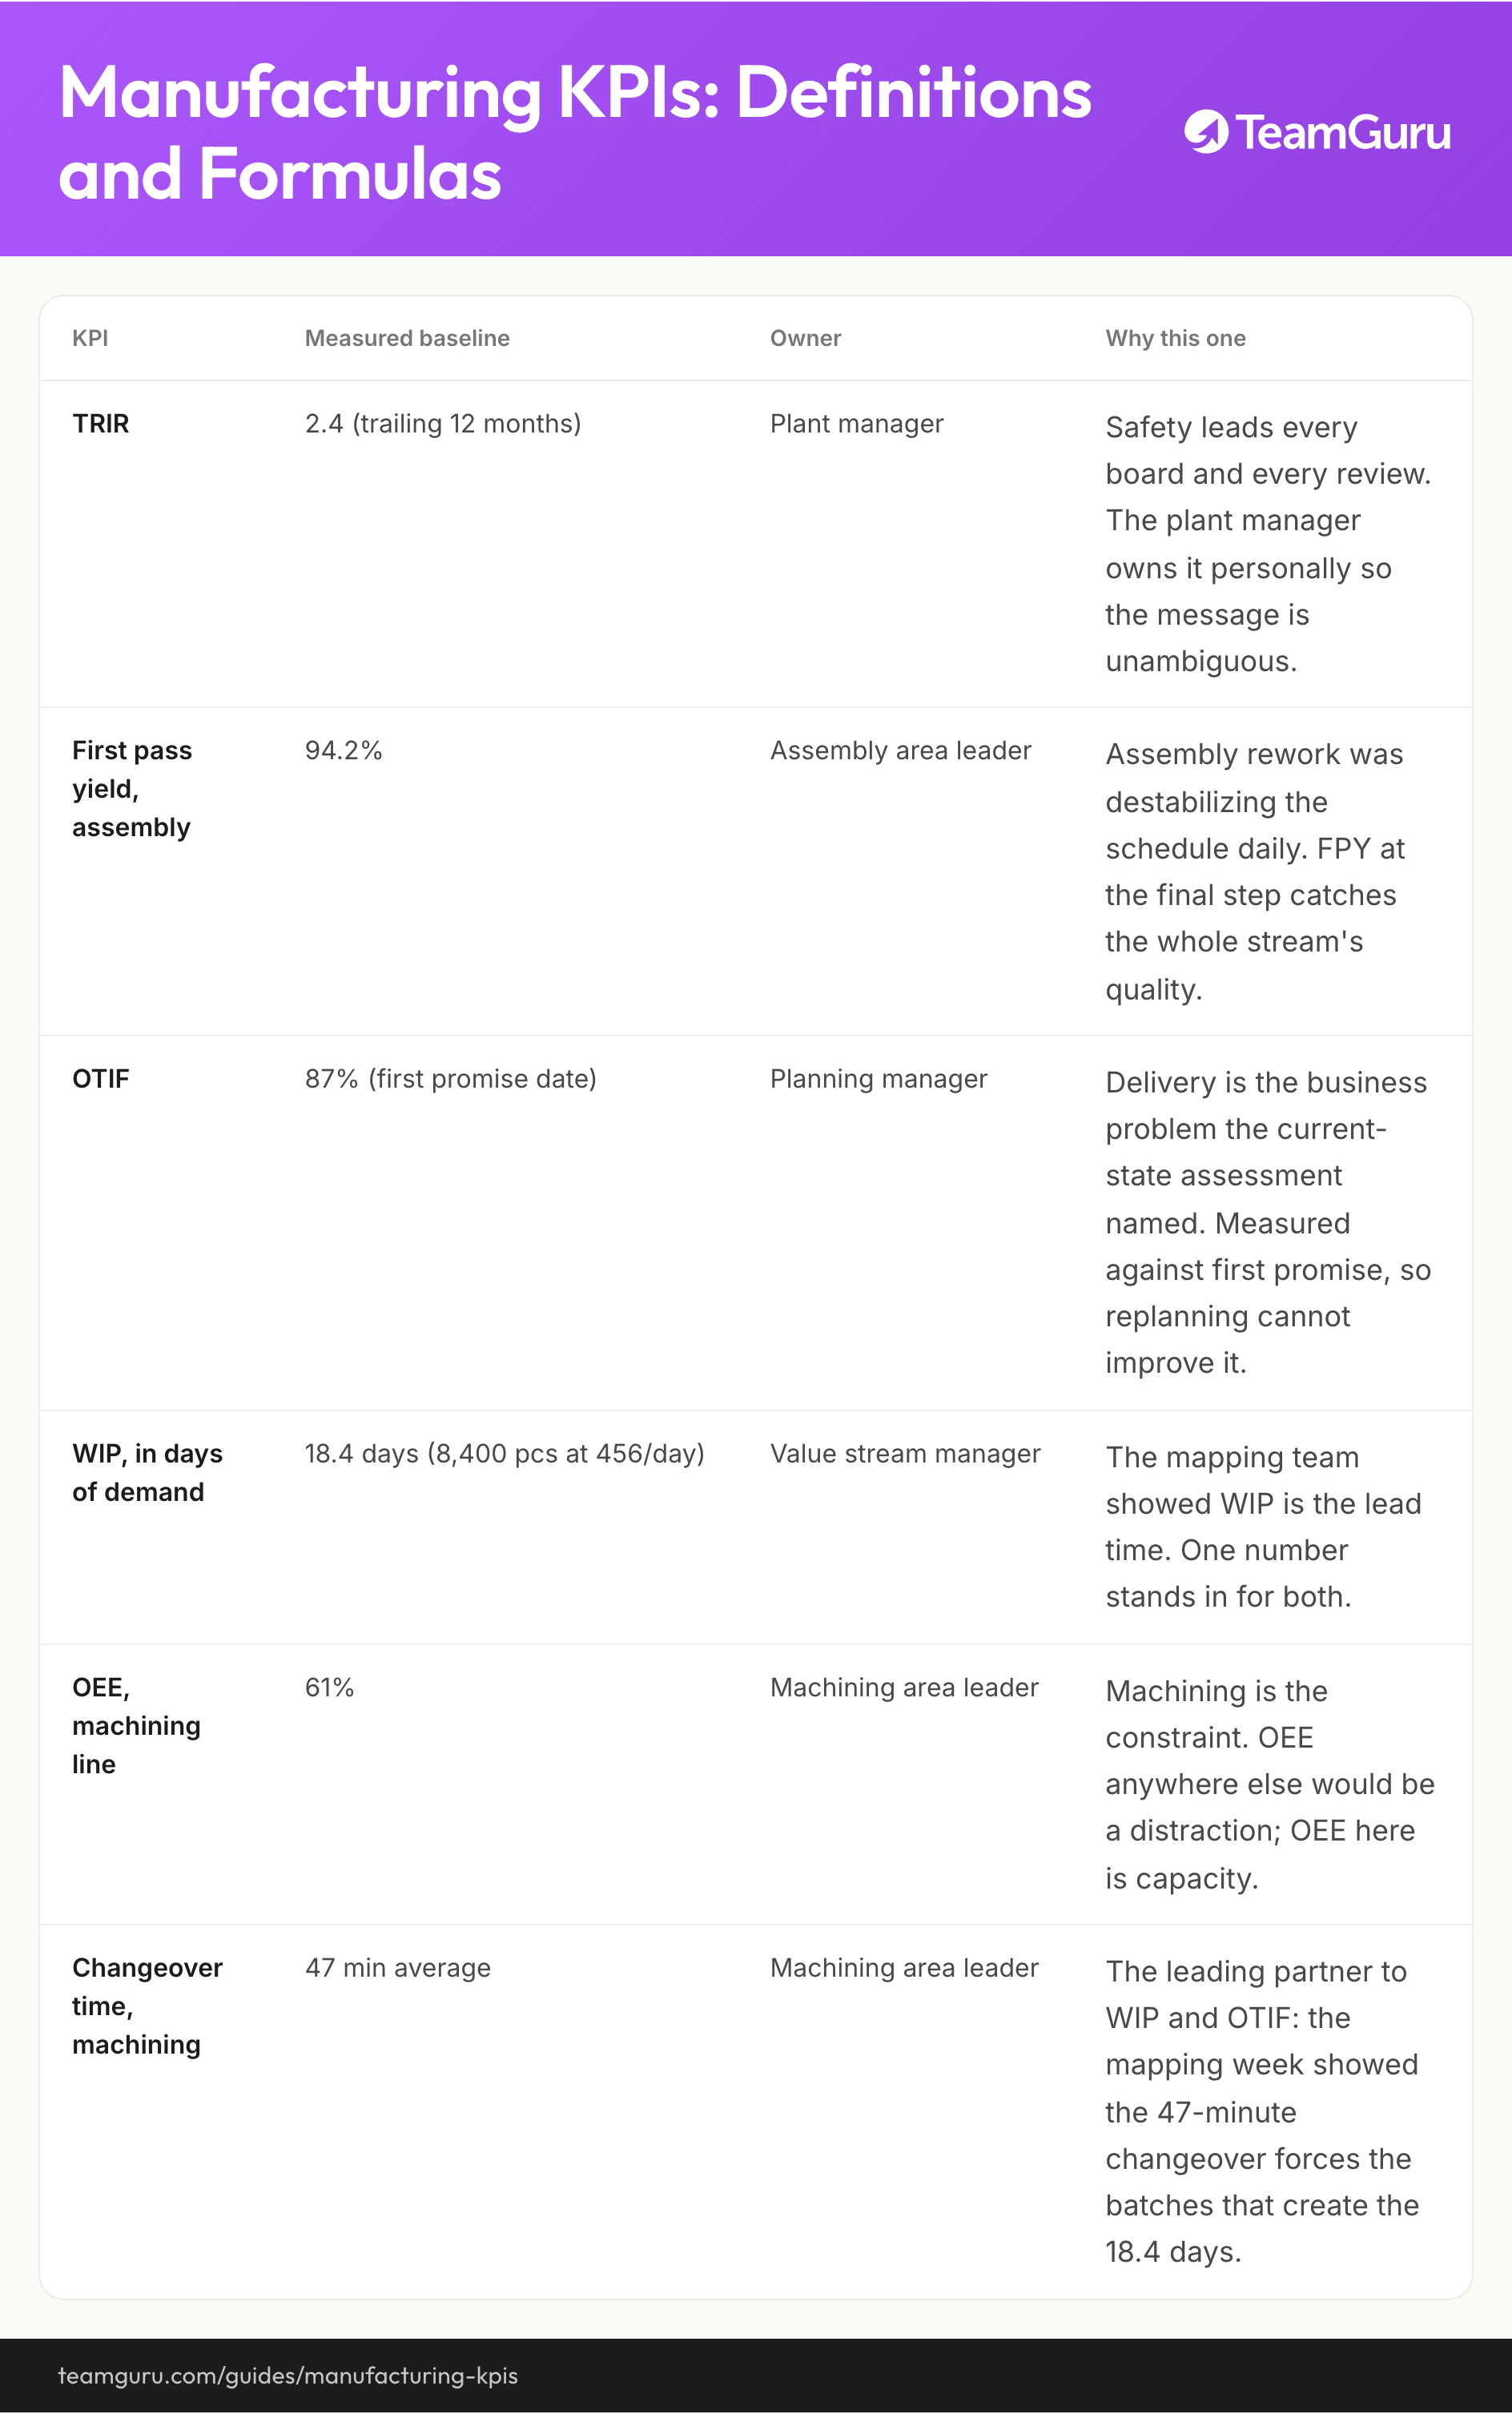
The numbers below are illustrative but internally consistent, for the same 450-person components manufacturer used across the transformation roadmap: 456 units per day of demand across two shifts, delivery named as the business problem, machining identified as the constraint, and a mapping week that found 8,400 pieces of WIP and a 47-minute changeover. The site chose six starting KPIs, and every choice traces back to a selection rule:
| KPI | Measured baseline | Owner | Why this one |
|---|---|---|---|
| TRIR | 2.4 (trailing 12 months) | Plant manager | Safety leads every board and every review. The plant manager owns it personally so the message is unambiguous. |
| First pass yield, assembly | 94.2% | Assembly area leader | Assembly rework was destabilizing the schedule daily. FPY at the final step catches the whole stream's quality. |
| OTIF | 87% (first promise date) | Planning manager | Delivery is the business problem the current-state assessment named. Measured against first promise, so replanning cannot improve it. |
| WIP, in days of demand | 18.4 days (8,400 pcs at 456/day) | Value stream manager | The mapping team showed WIP is the lead time. One number stands in for both. |
| OEE, machining line | 61% | Machining area leader | Machining is the constraint. OEE anywhere else would be a distraction; OEE here is capacity. |
| Changeover time, machining | 47 min average | Machining area leader | The leading partner to WIP and OTIF: the mapping week showed the 47-minute changeover forces the batches that create the 18.4 days. |
Notice what is absent. No inventory turns, because WIP days carries the same signal at a level the value stream manager can act on. No labor productivity, because with delivery as the problem it would pull attention toward running machines flat out, which is how the 8,400 pieces of WIP happened in the first place. And no targets yet: those arrive through strategy deployment after four weeks of baseline data, so the first targets are set against reality instead of aspiration.
From numbers to management
A baselined KPI set is an instrument panel, not a management system. Three practices turn it into one. First, cascade: a KPI tree connects each plant number to the area and shift numbers that drive it, so a shift improving its schedule adherence knows it is moving the plant's OTIF. Second, rhythm: the shift-level numbers go onto SQDIP boards reviewed in the daily management cycle, where a red number becomes an action with a name and a date within 24 hours. Third, escalation upward: weekly and monthly reviews work the trends the daily cycle cannot fix alone.
This is also the point where spreadsheets give out: definitions fork into local copies, the baseline gets retyped, and the review runs on numbers nobody fully trusts again. In TeamGuru, each KPI lives once, with its definition, owner, baseline and history, through KPI management, and the boards and reviews read from that single record through reporting, so the daily board, the monthly review and the plant manager's phone all show the same number.
On the roadmap, the next moves are strategy deployment, which sets targets on the baseline and turns the biggest gaps into the plant's few owned priorities, and daily management, which puts the numbers to work every morning.
Take this with you
The diagram from this guide as a shareable image, free to reuse in internal training and workshops.
Download PNGFrequently asked questions
What are the most important KPIs in manufacturing?
Is there a standard list of manufacturing KPIs?
How many KPIs should a manufacturing plant have?
What is the difference between leading and lagging KPIs?
What is the difference between a KPI and a metric?
How often should manufacturing KPIs be reviewed?
What is a good on-time delivery benchmark?
Who should own a KPI?
How TeamGuru runs this