Guía de implementación
Matriz X (Hoshin Kanri).
La matriz X es el registro Hoshin Kanri, en una página, de cinco decisiones y sus conexiones: los objetivos de ruptura de 3 a 5 años, los objetivos de este año, las iniciativas con las que se lograrán, los indicadores que lo demostrarán y el responsable de cada iniciativa. Se lee en sentido antihorario desde abajo: sur, oeste, norte, este y responsables. Si mantenerla cuesta más tiempo que discutirla, es un proyecto artístico, no despliegue de la estrategia.
Qué es la matriz X
Una matriz X (X-Matrix, también llamada matriz Hoshin, matriz X de Hoshin o matriz de despliegue de políticas) es una sola página A3 que registra cinco decisiones: qué debe lograr el negocio en los próximos 3 a 5 años, qué logrará este año, qué iniciativas de mejora lo llevarán ahí, qué indicadores demostrarán el avance y quién responde por cada iniciativa. La X del centro es pura geometría. Las cuatro listas se colocan alrededor de modo que las listas vecinas comparten una esquina, y cada esquina contiene los puntos de correlación que conectan elementos individuales.
El formato de una página resuelve un problema concreto: vuelve verificable la alineación. Una presentación de estrategia puede afirmar que todo apoya a todo, y nadie lo puede comprobar. En una matriz X las afirmaciones son físicas. Cada iniciativa tiene que rastrearse, a través de un punto, hasta un objetivo anual; cada objetivo anual hasta un objetivo de ruptura; cada indicador hasta una iniciativa y un responsable. Una iniciativa con la fila vacía queda expuesta. Un indicador sin responsable queda expuesto. La página no deja espacio para los matices cómodos, y por eso los equipos directivos o la adoran o dejan de usarla en silencio.
Nuestra postura es directa: la matriz X es el registro de cinco decisiones y sus conexiones, nada más. Las decisiones se toman conversando, y la matriz las pone por escrito para poder revisarlas cada mes. Si mantener la matriz cuesta más tiempo que discutir lo que hay en ella, la está usando como proyecto artístico, y el arte no va a mover ni un indicador.
Dónde encaja en la hoja de ruta de transformación
La matriz X pertenece a la práctica de despliegue de la estrategia, dentro de la etapa Construir el marco de la hoja de ruta de despliegue. Es el resultado escrito de la conversación Hoshin, no un sustituto de ella: Hoshin Kanri es el sistema de gestión completo, las rondas de catchball son la negociación que llena los cuadrantes, y esta guía trata el registro de una página donde aterrizan los resultados. Constrúyala después de que el diagnóstico haya delimitado las brechas y en paralelo con el diseño del estado futuro, porque de las brechas del estado futuro sale la mayoría de los objetivos de ruptura.
- Antes Diagnóstico del estado actual
- Está aquí Despliegue de la estrategia
- En paralelo Diseño del estado futuro
- Después Gestión diaria
Cuándo no necesita una
La matriz se gana su lugar cuando las conexiones se multiplican. Cuatro objetivos de ruptura, cinco objetivos anuales, seis iniciativas y ocho indicadores producen bastante más de cien intersecciones posibles, y con esa densidad una lista simple esconde las brechas que la matriz revela. Por debajo de esa densidad, sáltesela:
- Un solo sitio con menos de unas cinco iniciativas en marcha puede poner objetivo de ruptura, objetivo anual, iniciativa, indicador y responsable en una tabla de cinco columnas sin perder nada. Use la tabla hasta que deje de ser evidente quién apoya qué.
- Los objetivos de ruptura todavía no existen. La matriz registra decisiones; no puede generarlas. Primero haga el trabajo de pensar la estrategia.
- No ha habido catchball. Una matriz que llena el director de planta a solas no despliega nada, porque las personas que aparecen en los cuadrantes oeste y norte no han aceptado estar ahí.
- El motivo es una auditoría de certificación o una plantilla corporativa. Una matriz de cumplimiento se plastifica, y plastificada quiere decir terminada, y terminada quiere decir muerta.
Cómo leer una matriz X
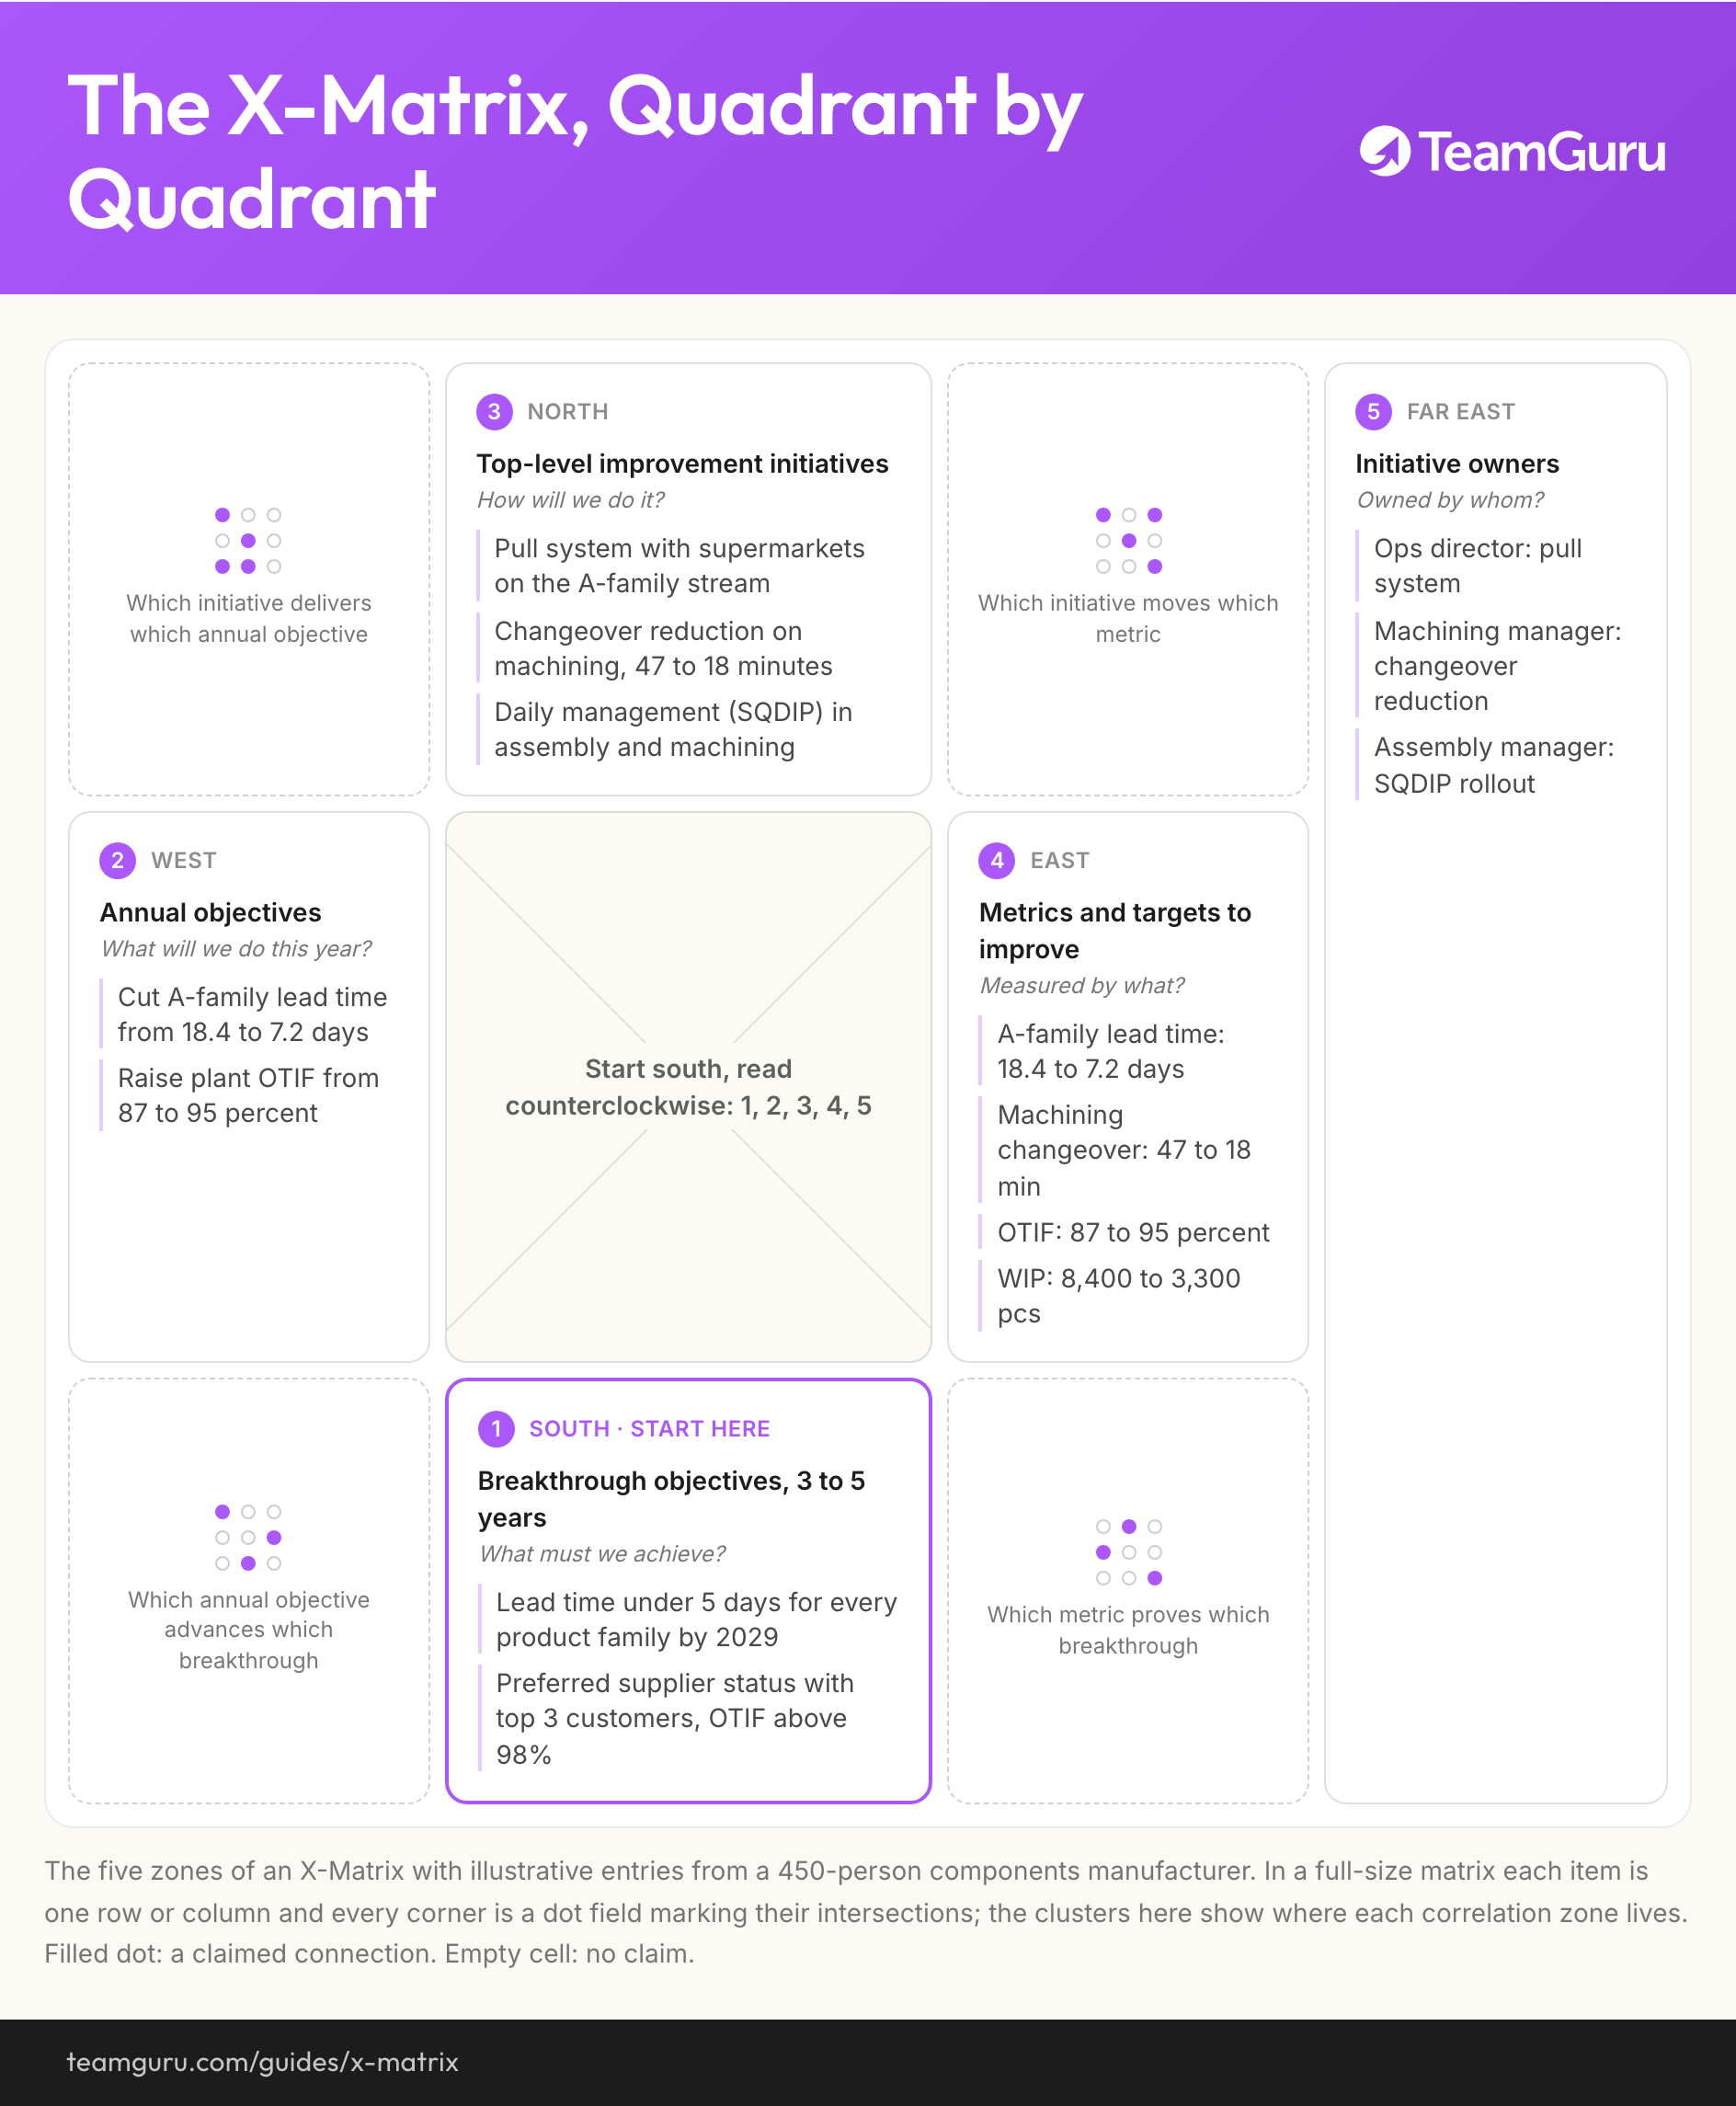
Lea en sentido antihorario, es decir, contrario a las manecillas del reloj, empezando por abajo: sur, oeste, norte, este y después la columna de responsables del extremo derecho. En palabras: qué debemos lograr en años, qué haremos este año, cómo, medido con qué, a cargo de quién. El recorrido de abajo muestra cada zona con entradas ilustrativas del fabricante de componentes de 450 personas que se usa en todas estas guías (456 unidades al día, dos turnos, 54,000 segundos de tiempo de trabajo diario).
Qué iniciativa cumple qué objetivo anual
Iniciativas de mejora de alto nivel
¿Cómo lo haremos?
- Sistema pull con supermercados en el flujo de la familia A
- Reducción del cambio de modelo en maquinado, de 47 a 18 minutos
- Gestión diaria (SQDIP) en ensamble y maquinado
Qué iniciativa mueve qué indicador
Responsables de las iniciativas
¿A cargo de quién?
- Director de operaciones: sistema pull
- Gerente de maquinado: reducción del cambio de modelo
- Gerente de ensamble: despliegue de SQDIP
Objetivos anuales
¿Qué haremos este año?
- Bajar el lead time de la familia A de 18.4 a 7.2 días
- Subir el OTIF de la planta del 87 al 95 por ciento
Empiece por el sur y lea en sentido antihorario: 1, 2, 3, 4, 5
Indicadores y metas por mejorar
¿Medido con qué?
- Lead time de la familia A: de 18.4 a 7.2 días
- Cambio de modelo en maquinado: de 47 a 18 min
- OTIF: del 87 al 95 por ciento
- WIP: de 8,400 a 3,300 pzas
Qué objetivo anual hace avanzar qué objetivo de ruptura
Objetivos de ruptura, 3 a 5 años
¿Qué debemos lograr?
- Lead time por debajo de 5 días para cada familia de producto en 2029
- Estatus de proveedor preferente con los 3 clientes principales, OTIF por encima del 98 por ciento
Qué indicador demuestra qué objetivo de ruptura
Qué afirman las esquinas
Las esquinas son el sentido de todo el formato. Cada punto es una afirmación concreta y verificable sobre dos elementos:
- Esquina suroeste: cada punto afirma que un objetivo anual (oeste) hace avanzar un objetivo de ruptura (sur). Un objetivo anual sin punto en esta esquina es actividad sin rumbo.
- Esquina noroeste: cada punto afirma que una iniciativa (norte) cumple un objetivo anual (oeste). Aquí quedan al descubierto los proyectos favoritos, porque no ganan ningún punto.
- Esquina noreste: cada punto afirma que una iniciativa (norte) mueve un indicador (este). Si no puede decir qué número va a cambiar una iniciativa, la iniciativa es una esperanza.
- Esquina sureste: cada punto afirma que un indicador (este) demuestra el avance de un objetivo de ruptura (sur). Un objetivo de ruptura sin rastro de evidencia medible es un eslogan.
- Columna del extremo este: los puntos (o los nombres) atan cada iniciativa a una persona responsable. No a un departamento, a una persona.
Leyendo nuestra matriz de ejemplo de principio a fin: el estatus de proveedor preferente para 2029 (sur) avanza este año subiendo el OTIF del 87 al 95 por ciento (oeste), se logra con las iniciativas de sistema pull y gestión diaria (norte), se demuestra con las cifras de OTIF y de WIP (este) y está a cargo del director de operaciones y del gerente de ensamble (extremo este). Cinco decisiones, una sola línea rastreable.
Cómo construirla en una tarde
La matriz se llena en una sesión de trabajo, no la arma un planificador. Reserve una tarde con el equipo directivo del sitio, después de que las rondas de catchball hayan negociado los objetivos y antes de que empiece el año. Si la sesión necesita una segunda tarde, el trabajo de catchball quedó incompleto. Si construir la matriz toma un mes, usted está formateando, no decidiendo.
Todos los que van a aparecer en la columna de responsables están en la sala. Un A3 impreso o una pantalla compartida, y una regla dura de 3 a 5 elementos por cuadrante. Llénela en este orden:
Sur: objetivos de ruptura, 3 a 5 años
Pregunta que responde: ¿Qué debemos lograr en los próximos 3 a 5 años que el presupuesto anual normal no va a conseguir por sí solo?
Error frecuente: Listar todos los deseos estratégicos. Tres o cuatro objetivos de ruptura, cinco como límite absoluto. Si todo es una ruptura, nada lo es.
Oeste: objetivos anuales
Pregunta que responde: ¿Qué vamos a lograr en los próximos 12 meses en dirección a esos objetivos de ruptura?
Error frecuente: Escribir el año pasado más cinco por ciento. Un objetivo anual que no se rastrea hasta un objetivo de ruptura es administración de presupuesto, no despliegue.
Norte: iniciativas de mejora de alto nivel
Pregunta que responde: ¿Con qué iniciativas concretas se van a lograr los objetivos de este año?
Error frecuente: Copiar los proyectos departamentales que iban a correr de todos modos, de modo que la matriz ratifica la actividad actual en lugar de dirigirla.
Este: indicadores y metas por mejorar
Pregunta que responde: ¿Qué números nos dirán, mes a mes, que las iniciativas están funcionando?
Error frecuente: Elegir indicadores que hoy nadie mide, o solo resultados financieros rezagados. La primera revisión mensual se queda entonces sin nada que revisar.
Esquinas: puntos de correlación
Pregunta que responde: ¿Qué elemento se conecta de verdad con cuál, como relación primaria o de apoyo?
Error frecuente: Poner los puntos por diplomacia para que todo correlacione con todo. Una matriz donde cada intersección lleva un punto no dice nada.
Extremo este: responsables
Pregunta que responde: ¿Qué persona, con nombre y apellido, responde por cada iniciativa?
Error frecuente: Asignar departamentos en lugar de personas, o cargar a una sola persona con cuatro iniciativas y llamarlo compromiso.
Termine la sesión con cada responsable diciendo en voz alta qué iniciativa le corresponde y qué número del cuadrante este mostrará su avance. Esa frase es el despliegue. La matriz solo la recuerda.
La disciplina de la correlación
Un punto es una afirmación que alguien puede cuestionar, y el cuestionamiento es el valor. Cuando el gerente de maquinado coloca un punto que conecta la iniciativa de cambio de modelo con el indicador de lead time, cualquiera en la sala puede preguntar: ¿cómo, exactamente? En este caso la respuesta existe: cambios de modelo más cortos permiten lotes más chicos, y los lotes más chicos recortan el tiempo en cola, así que el punto sobrevive. Un punto que no sobrevive a esa pregunta se borra delante de todos, lo cual incomoda una vez y aclara para siempre.
Las filas y las columnas vacías son hallazgos, no errores de formato. Una iniciativa cuya fila no cruza ningún objetivo anual ni ningún indicador está consumiendo capacidad sin apoyar nada: cancélela o aplácela, en la sesión y con el patrocinador presente. Un indicador al que no apunta ninguna iniciativa no se va a mover este año, así que deje de fingir que es una meta o agregue la iniciativa que lo mueve. Un indicador sin responsable recibe uno antes de que termine la reunión. Los equipos que suavizan esta disciplina, poniendo puntos por diplomacia para que ninguna iniciativa parezca huérfana, terminan con una matriz donde todo correlaciona con todo, que lleva exactamente tanta información como una hoja en blanco.
Una regla práctica: cada iniciativa debería llevar un punto fuerte por esquina, dos como máximo. Si una iniciativa afirma mover cinco indicadores, su responsable no ha decidido para qué sirve.
Cómo mantenerla viva
La matriz sigue viva gracias a un solo hábito: la revisión por la dirección mensual abre en el cuadrante este. Cada indicador se compara con su trayectoria objetivo, cada número desviado dispara una conversación con el responsable de la iniciativa cuyo punto apunta hacia él, y el estatus se marca directamente sobre la matriz. Diez minutos de marcar, no una tarde de reformatear.
Reglas de reescritura: la matriz completa se reconstruye una vez al año, en la planeación anual. A mitad de año se permite reescribir los cuadrantes oeste y norte bajo exactamente dos condiciones: que un objetivo anual sea claramente inalcanzable y fingir lo contrario corrompería las revisiones, o que la estrategia misma haya cambiado. El cuadrante sur cambia solo con la estrategia. Si los objetivos de ruptura se mueven cada trimestre, nunca fueron rupturas.
Cómo se ve lo malo
- Doce iniciativas, porque nadie en la sala pudo decir que no
- Puntos puestos por diplomacia para que todo correlacione con todo
- La matriz está plastificada, enmarcada y sin tocar desde enero
- Un analista la mantiene; los responsables la ven dos veces al año
- El estatus se reporta en una presentación aparte que la matriz nunca conoce
Cómo se ve lo bueno
- De tres a cinco elementos por cuadrante, cada uno defendido con argumentos
- Cada punto sobrevivió a un cuestionamiento en la sesión de trabajo
- La revisión mensual abre con los números del cuadrante este
- Una iniciativa se canceló a mitad de año porque su fila quedó vacía
- La copia de trabajo está rayada, anotada y un poco fea
Qué pasa después
La matriz es la parte alta de una cadena, no su final. Los indicadores del cuadrante este bajan al árbol de KPIs, donde cada número de planta se descompone en las medidas de línea y de celda en las que la gente sí puede influir, y de ahí a los tableros SQDIP, llamados paneles en España, que la gestión diaria revisa cada mañana. Cuando esa cadena está conectada, el tablero de un supervisor de primera línea y la matriz de la dirección no se contradicen en nada, que es lo que significa desplegar.
La cadena es también el punto donde el papel deja de alcanzar. En el caso de uso de despliegue de la estrategia de TeamGuru la matriz se vuelve un objeto de trabajo: los objetivos de ruptura se enlazan con los objetivos anuales, los objetivos con iniciativas que tienen acciones con responsable y fecha, y bajar de un objetivo de ruptura de 2029 a la acción vencida de esta semana toma dos clics. La revisión mensual lee entonces cifras vivas en lugar de la presentación del mes pasado, y la matriz nunca necesita plastificarse, porque nunca se imprimió.
Lléveselo consigo
El diagrama de esta guía como imagen, de uso libre en formaciones internas y talleres.
Descargar PNGPreguntas frecuentes
¿Cuáles son los cuatro cuadrantes de una matriz X?
¿Por dónde empiezo a llenar una matriz X?
¿Cuántos objetivos e iniciativas caben en una matriz X?
¿Qué significan los puntos de correlación de una matriz X?
¿Conviene armar la matriz X en Excel, en PowerPoint o en software dedicado?
¿Cada cuánto debe actualizarse la matriz X?
Cómo lo lleva a la práctica TeamGuru