Guía de implementación
Árbol de KPIs.
Un árbol de KPIs (KPI tree) es un mapa causal de una página que enlaza un resultado de negocio, a través de dos a cuatro indicadores impulsores, con las cifras del piso de producción que un turno puede mover. No es una jerarquía de reportes, sino un argumento causal: mejore las hojas y el resultado de arriba tiene que moverse. Cada nodo necesita un responsable y una decisión; la rama que no puede explicar su vínculo causal se poda.
Qué es un árbol de KPIs
Un árbol de KPIs (en inglés, KPI tree), llamado también árbol de KPI, árbol de indicadores o árbol de métricas, descompone un solo resultado de negocio en los impulsores medibles que lo causan, nivel por nivel, hasta llegar a cifras sobre las que un turno puede influir antes de la comida. Arriba se coloca un resultado que el negocio reconoce: entrega a tiempo, costo por unidad, fugas al cliente. Debajo, de dos a cuatro impulsores que explican la mayor parte del movimiento de ese resultado. Y debajo de ellos, los indicadores del piso de producción que mueven cada impulsor: minutos de cambio de modelo, horas de paro, rendimiento a la primera, faltantes.
La palabra que carga con el peso aquí es causa. Un árbol de KPIs no es una jerarquía de reportes que muestra quién envía qué número a quién. Es un argumento causal escrito como diagrama: mejore estos indicadores hoja y el impulsor de arriba tiene que moverse; mueva los impulsores y el resultado de negocio tiene que seguirlos. Cada línea de conexión es una afirmación sobre cómo se comporta realmente la planta, y toda afirmación puede estar equivocada. Eso no es un defecto, es la función. El árbol hace explícita la teoría del desempeño de la planta, para que esa teoría pueda contrastarse con datos y corregirse en lugar de vivir como supuesto privado en una docena de cabezas.
Dos disciplinas separan un árbol que funciona de la decoración de pared. Primera, cada KPI del árbol lleva un responsable y una decisión a la que sirve. Un número que no es de nadie es trivia, y un número que nunca cambia una decisión es reportar por reportar. Segunda, cada rama debe poder explicar su vínculo causal en una frase. Si no puede, se poda, por muy disponibles que estén los datos y por muchos años que ese indicador lleve en el paquete mensual.
Dónde encaja en la hoja de ruta de transformación
En la hoja de ruta de transformación el árbol de KPIs pertenece al diseño del estado futuro de la etapa «Construir el marco». Viene después de los KPI de línea base por una razón simple: un árbol construido antes de que la planta confíe en sus mediciones es un argumento causal levantado sobre números que nadie cree. Avanza en paralelo con el despliegue de la estrategia, porque el árbol es el puente entre los dos mundos que conecta Hoshin Kanri: el puñado de metas desplegadas arriba y los tableros diarios abajo. Las hojas de un buen árbol son exactamente las letras que un tablero SQDIP lleva cada mañana.
- Antes KPI de línea base
- Está aquí Diseño del estado futuro
- En paralelo Despliegue de la estrategia
- Después Gestión diaria
Cuándo fallan los árboles
La mayoría de los árboles de KPI que fracasan lo hacen antes de la primera revisión, de una de estas tres maneras:
- El espejo de finanzas. El árbol reproduce el estado de resultados o el organigrama: el costo de planta se desglosa en costos por departamento, que se desglosan en centros de costo. Cada línea es una identidad aritmética y ninguna es una afirmación causal, así que el árbol nunca puede decirle a nadie qué hacer distinto. Descomponer un número no es lo mismo que explicarlo.
- El bosque de 60 nodos. Cada indicador que la planta ya mide se lleva su rama para que nadie se sienta excluido. El árbol deja de ser un argumento y se convierte en un inventario; la revisión visita doce ramas y no actúa sobre ninguna.
- Indicadores sin responsable. El árbol se dibuja, se admira y se plastifica, pero ningún nodo lleva un nombre. Seis semanas después nadie sabe decir quién debía reaccionar cuando los faltantes en los supermercados se duplicaron.
Las tres tienen la misma raíz: el árbol se construyó como ejercicio de reporte y no como argumento. El método de construcción que sigue está diseñado para forzar el argumento.
Cómo construir uno
Construya el árbol en un taller de medio día, no en una hoja de cálculo a lo largo de tres semanas. En la sala hacen falta el gerente de planta, el responsable del flujo de valor o de producción, los supervisores que serán dueños de las hojas, un controller que fije la definición del resultado y un facilitador. La materia prima es el diagnóstico que la planta ya tiene: el mapa de flujo de valor señala los impulsores del flujo, y la línea base de KPI dice en qué números se puede confiar hoy. El taller recorre seis pasos, en orden:
- Fije el resultado y su definición. Un resultado por árbol. Escriba la fórmula exacta en la pared: la entrega a tiempo de quién, medida frente a qué fecha, la solicitada o la confirmada. La mitad de las discusiones sobre KPI son discusiones de definición disfrazadas.
- Pregunte qué tendría que ser cierto. Para que el resultado alcance su meta, ¿qué debe cumplirse en la operación? Reúna candidatos, quédese con los dos a cuatro impulsores que explican la mayor parte del movimiento y diga el mecanismo en voz alta para cada uno: creemos que el cumplimiento del programa mueve la entrega a tiempo porque la mayoría de los incumplimientos empiezan como desviaciones del programa.
- Repita un nivel más abajo. Para cada impulsor, nombre las cifras del piso de producción que lo mueven y sobre las que un turno puede influir en cuestión de días. Si una hoja candidata solo se mueve con un proyecto de inversión, es una iniciativa, no una hoja.
- Pruebe los vínculos. Donde haya datos históricos, grafique la hoja frente a la rama a lo largo del último año y compruebe que se mueven juntas. Donde no los haya, marque el vínculo como hipótesis, por escrito, en el árbol. Una suposición marcada es honesta; una sin marcar se vuelve folclore.
- Asigne responsable, ritmo y decisión. Cada nodo recibe un responsable con nombre, la revisión en la que se lee y la decisión a la que sirve. Si la sala no puede nombrar una decisión que ese indicador alimenta, el indicador se cae.
- Baje las metas, revise la aritmética hacia arriba. Despliegue la meta del resultado hacia abajo por las ramas y después revise hacia arriba: ¿las metas de las hojas sostienen de forma plausible la meta de la rama? Si cambios de modelo de 18 minutos y 10 horas de paro siguen sin sumar 96 por ciento de cumplimiento del programa, al árbol le falta un impulsor, y más vale enterarse ahora.
Reglas para construir el árbol
Seis reglas mantienen honesto el taller y también cada revisión posterior:
- Empiece por un resultado de negocio. Un árbol por resultado y no más de tres árboles por planta. Un árbol para todo es un árbol para nada.
- Construya cada nivel preguntando qué tendría que ser cierto para que se mueva el nivel de arriba, y nombre el mecanismo. El folclore de las correlaciones no sobrevive a un mal trimestre.
- Tres niveles bastan para una planta: resultado, impulsores y hojas del piso de producción. Un cuarto nivel suele significar que está dibujando otra vez el organigrama.
- Cada hoja tiene que poder gestionarse a nivel de turno: legible en el propio proceso sin necesidad de un reporte, y que quienes la ven puedan moverla en días, no en trimestres.
- Indicadores adelantados abajo, indicadores rezagados arriba. La raíz confirma lo que las hojas predijeron; si las hojas no predicen nada, son las hojas equivocadas.
- Pode cada año. Una rama que no puede explicar su vínculo causal, o un nodo que no alimentó ninguna decisión en todo el año, se cae. El árbol se gana su tamaño.
Ejemplo resuelto: un árbol de entrega a tiempo
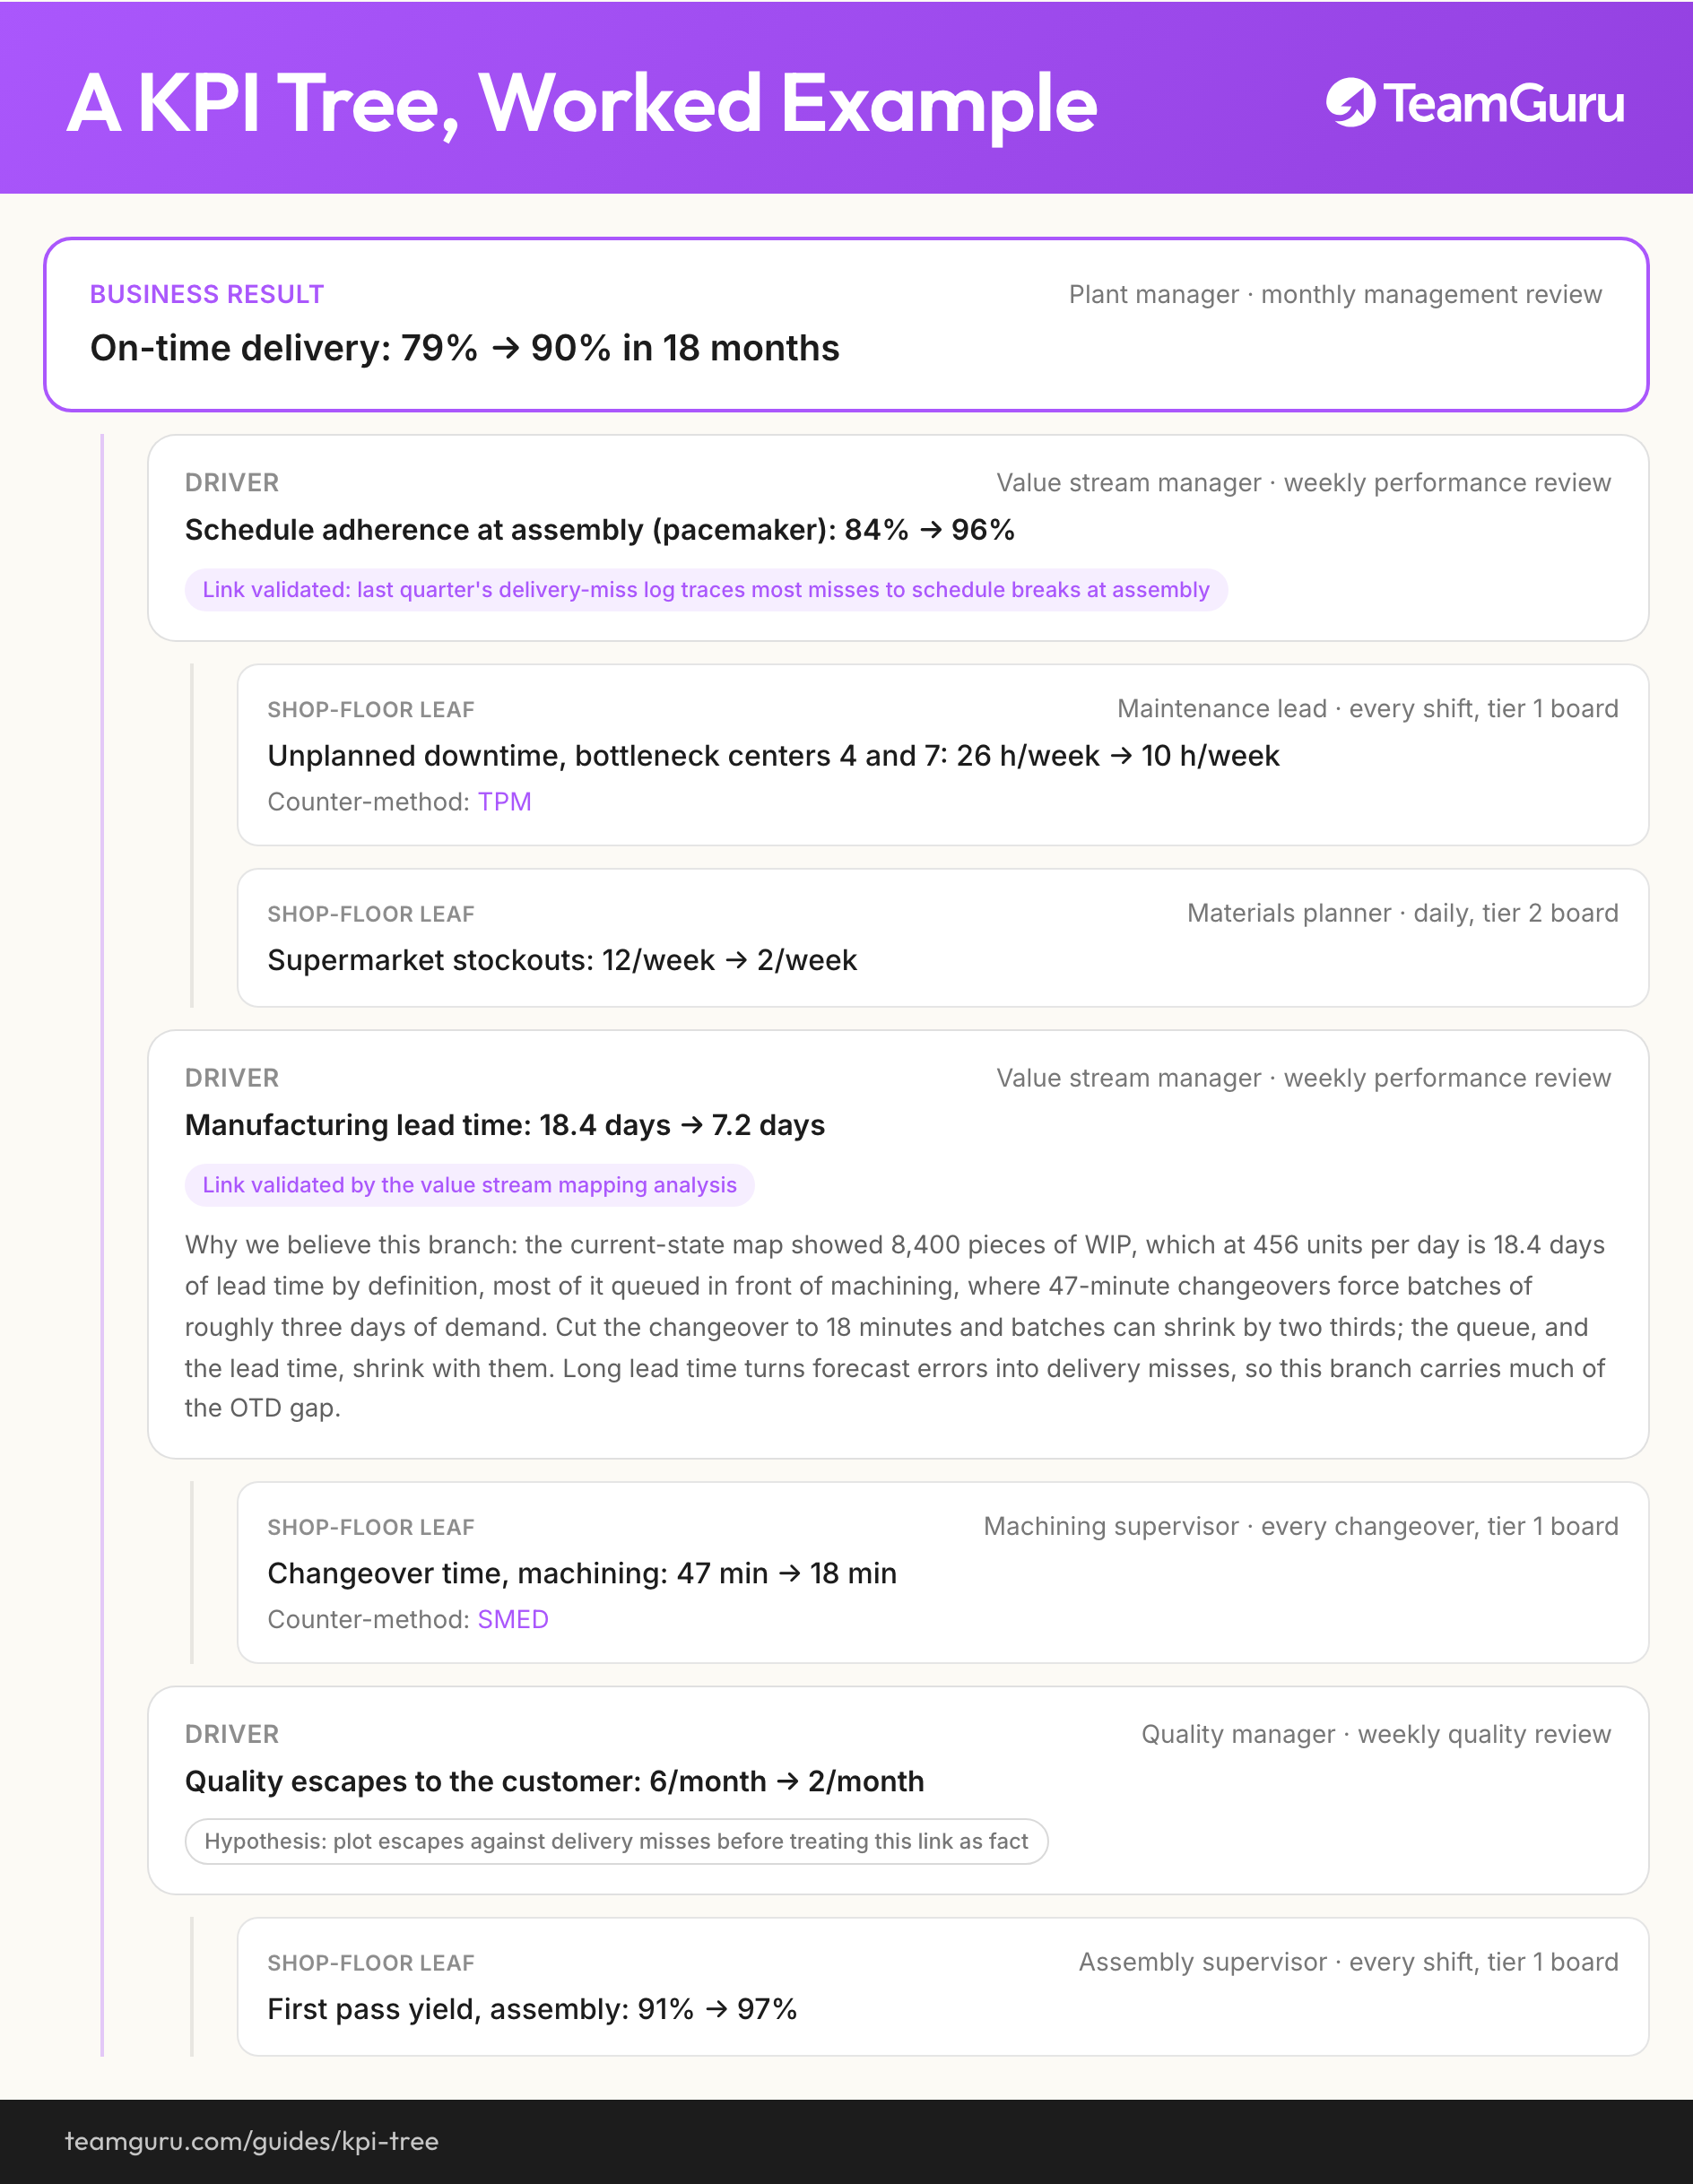
El árbol de abajo es ilustrativo, pero internamente coherente, y corresponde al mismo fabricante de componentes de 450 personas que se usa en toda la hoja de ruta de transformación: 456 unidades por día entre corte, maquinado, soldadura y ensamble, con la entrega a tiempo estancada en el 79 por ciento y una meta desplegada del 90 por ciento en 18 meses. Los impulsores no se inventaron en el taller. Salieron del diagnóstico: el mapa de flujo de valor midió 18.4 días de tiempo de entrega contra 42 minutos de proceso, cambios de modelo de 47 minutos en maquinado y 26 horas semanales de paro no planificado en los dos centros cuello de botella.
Resultado de negocio
Gerente de planta · revisión mensual por la dirección
Entrega a tiempo: 79% → 90% en 18 meses
-
Impulsor
Responsable del flujo de valor · revisión semanal de desempeño
Cumplimiento del programa en ensamble (marcapasos): 84% → 96%
Vínculo validado: el registro de incumplimientos de entrega del último trimestre atribuye la mayoría a desviaciones del programa en ensamble
-
Hoja del piso de producción
Jefe de mantenimiento · cada turno, tablero tier 1
Paro no planificado, centros cuello de botella 4 y 7: 26 h/semana → 10 h/semana
Contramedida: TPM
-
Hoja del piso de producción
Planeador de materiales · diario, tablero tier 2
Faltantes en supermercados: 12/semana → 2/semana
-
-
Impulsor
Responsable del flujo de valor · revisión semanal de desempeño
Tiempo de entrega de manufactura: 18.4 días → 7.2 días
Vínculo validado por el análisis del mapa de flujo de valor
Por qué creemos en esta rama: el mapa del estado actual mostró 8,400 piezas de inventario en proceso, que a 456 unidades por día son, por definición, 18.4 días de tiempo de entrega, la mayor parte en cola frente a maquinado, donde cambios de modelo de 47 minutos obligan a lotes de unos tres días de demanda. Baje el cambio a 18 minutos y los lotes pueden reducirse dos tercios; la cola, y con ella el tiempo de entrega, se reducen igual. Un tiempo de entrega largo convierte los errores de pronóstico en incumplimientos de entrega, así que esta rama carga buena parte de la brecha de entrega a tiempo.
-
Hoja del piso de producción
Supervisor de maquinado · cada cambio de modelo, tablero tier 1
Tiempo de cambio de modelo, maquinado: 47 min → 18 min
Contramedida: SMED
-
-
Impulsor
Gerente de calidad · revisión semanal de calidad
Fugas de calidad al cliente: 6/mes → 2/mes
Hipótesis: grafique las fugas contra los incumplimientos de entrega antes de tratar este vínculo como un hecho
-
Hoja del piso de producción
Supervisor de ensamble · cada turno, tablero tier 1
Rendimiento a la primera, ensamble: 91% → 97%
-
Lea el árbol como el argumento que es. Las entregas se incumplen porque ensamble rompe el programa, porque los pedidos pasan 18 días dentro de la planta y porque las fugas disparan selección y retrabajo en los peores momentos. Ensamble rompe el programa porque los centros cuello de botella se detienen sin aviso y porque los supermercados se quedan vacíos. El tiempo de entrega es de 18.4 días porque cambios de modelo de 47 minutos obligan a lotes de tres días. Cada frase es una línea del árbol, y cada una se puede contrastar con datos.
Fíjese en las marcas de confianza. La rama del tiempo de entrega lleva su razonamiento porque los datos del mapeo la sostienen; la rama de las fugas sigue siendo hipótesis hasta que alguien grafique las fugas contra los incumplimientos de entrega. Y fíjese en lo que el árbol deja fuera: el rendimiento a la primera también afecta al cumplimiento del programa a través del retrabajo, pero está en una sola rama, la del mecanismo más fuerte. Una casa por indicador es lo que impide que la misma mejora se reclame dos veces.
Trabajar con el árbol
Un árbol que nadie lee es un diagrama. Lo que lo convierte en instrumento de gestión es darle a cada nivel un lugar fijo en la cadencia de reuniones. Las hojas viven en los tableros tier 1 y tier 2, o paneles, como se les llama en España, y se leen cada turno o cada día; los minutos de cambio de modelo, las horas de paro y el rendimiento a la primera son justo lo que siguen las letras SQDIP. Los impulsores pertenecen a la revisión semanal del flujo de valor. La raíz pertenece a la revisión mensual por la dirección. El mismo árbol, los mismos números, tres altitudes. Cuando la revisión mensual pregunta por qué cayó la entrega a tiempo, la respuesta está dos niveles más abajo, en un tablero que se discutió el martes, y no en un análisis nuevo encargado para la reunión.
Los momentos más útiles en la vida del árbol son aquellos en los que el árbol se equivoca. Maquinado baja los cambios de modelo de 47 a 18 minutos y el tiempo de entrega apenas se mueve: eso no es un proyecto fallido, eso es el árbol aprendiendo. En este caso el eslabón que faltaba era el tamaño de lote. El tiempo de cambio bajó, pero planeación siguió liberando lotes de tres días, así que las colas siguieron igual. El árbol gana un nodo, el tamaño de lote, entre el cambio de modelo y el tiempo de entrega, y planeación gana una decisión propia. Un árbol que no ha cambiado en un año no es un árbol estable; es un árbol que nadie lee.
Por eso mismo cada nodo lleva la decisión a la que sirve. Las horas de paro alimentan la pelea semanal por la ventana de mantenimiento. Los faltantes alimentan el dimensionamiento de los supermercados. Los minutos de cambio de modelo alimentan el tamaño de lote y la secuencia. Cuando una revisión lee un número del que no se sigue ninguna decisión, ese número es candidato a la siguiente poda anual.
Modos de falla
Los errores de construcción quedaron arriba. Las fallas de operación aparecen una vez que el árbol está vivo, y son igual de previsibles:
Cómo se ve mal
- Dibujado en enero y nunca vuelto a tocar; en agosto describe una planta que ya no existe
- Metas negociadas hoja por hoja, así que cada hoja llega a su meta mientras la rama de arriba la incumple
- El mismo impulsor contado en dos ramas y la misma mejora reclamada dos veces en el plan anual
- Hojas revisadas cada mes en una sala de juntas en lugar de a diario en los tableros
- Vínculos hipotéticos tratados como hechos porque nadie escribió cuál era cuál
Cómo se ve bien
- Un resultado, tres niveles y cada responsable puede citar de memoria la meta de su nodo
- Vínculos marcados como validados o como hipótesis, y las marcas cambian a medida que llegan datos
- Metas de hoja que sostienen aritméticamente la meta de la rama que tienen encima
- Hojas en los tableros de turno, impulsores en la revisión semanal, la raíz en la revisión mensual
- Una poda anual en la que se caen los nodos que no alimentaron ninguna decisión
Qué viene después
Dos conexiones llevan el árbol adelante. Hacia arriba, la raíz y los impulsores son la materia prima del despliegue de la estrategia: las metas del árbol se negocian mediante Hoshin Kanri, no se anuncian, y las condiciones asociadas a cada meta se escriben junto a ella. Hacia abajo, las hojas tienen que aterrizar físicamente en los tableros del sistema de gestión diaria, porque una hoja que solo vive en el diagrama del árbol no la gestiona nadie. En la hoja de ruta, esa práctica siguiente es la gestión diaria.
El punto de ruptura entre esas dos conexiones es mecánico: el árbol vive en un dibujo, los tableros viven en la planta, las revisiones viven en hojas de cálculo y en un trimestre ya existen tres versiones de cada número. Este es el problema que elimina el caso de uso de gestión de KPI de TeamGuru: los indicadores, los responsables y las metas del árbol viven en un solo sistema, los tableros y los informes operativos leen las mismas cifras en vivo, y cuando el árbol aprende, todos los niveles ven el cambio la misma semana.
Lléveselo consigo
El diagrama de esta guía como imagen, de uso libre en formaciones internas y talleres.
Descargar PNGPreguntas frecuentes
¿Qué diferencia hay entre un árbol de KPIs, un árbol de indicadores impulsores y una matriz X?
¿Cuántos niveles debe tener un árbol de KPIs?
¿Cómo se validan los vínculos causales de un árbol de KPI?
¿Quién es el dueño del árbol de KPIs?
¿Cada cuánto se revisa un árbol de KPIs?
¿Un mismo KPI puede estar en dos ramas del árbol?
Cómo lo lleva a la práctica TeamGuru
Lectura adicional