Guide de mise en œuvre
Value Stream Mapping.
La VSM (Value Stream Mapping), ou cartographie de la chaîne de valeur, est la méthode Lean qui dessine comment la matière et l'information circulent réellement de la commande à la livraison, pour une seule famille de produits, et qui montre où le temps et la valeur se perdent. Une bonne semaine de cartographie produit trois choses : un état actuel auquel l'équipe croit, un état futur conçu ensemble et un plan d'amélioration priorisé. La carte n'est pas le livrable. Le plan l'est.
Ce qu'est la VSM, et à quoi elle sert
Une chaîne de valeur, ce sont toutes les étapes, à valeur ajoutée ou non, que traverse une famille de produits entre la commande et la livraison, plus le flux d'information qui déclenche chacune d'elles. La VSM dessine tout ce système sur une seule page : les processus avec leurs chiffres mesurés, le stock entre eux compté en jours, la logique d'ordonnancement en haut, et une ligne de temps en bas qui sépare le temps passé à travailler du temps passé à attendre.
La méthode vient de Toyota, où on l'appelait cartographie des flux de matières et d'informations (MIFA), et elle a été popularisée par Mike Rother et John Shook dans Learning to See. Le changement de nom compte moins que les deux mots que la plupart des cartes oublient : flux d'information. La majorité des problèmes de livraison ne viennent pas de machines lentes. Ils viennent de la façon dont le travail est ordonnancé, mis en lots et poussé d'une machine à l'autre.
La première découverte est en général inconfortable et utile : une pièce qui demande 42 minutes de transformation réelle passe deux semaines et demie dans le bâtiment. L'essentiel du lead time, c'est de l'attente, et l'attente vient de décisions que la carte rend visibles : les tailles de lot, les changements de série, le flux poussé, et du stock que personne n'a voulu.
Où la VSM se place dans la feuille de route
La VSM est un outil de diagnostic et de conception du début de parcours, pas une technique Lean isolée. Dans la feuille de route de déploiement TeamGuru elle appartient à l'étape Diagnostic : elle vient après un premier diagnostic de l'état actuel qui a posé le problème de l'entreprise, en parallèle des KPI de référence, et elle alimente directement la conception de l'état futur et les priorités portées par le déploiement de la stratégie.
- Avant Diagnostic de l'état actuel
- Vous êtes ici Value Stream Mapping
- En parallèle KPI de référence
- Après Conception de l'état futur
- Après Déploiement de la stratégie
Quand l'utiliser, et quand s'en passer
Cartographiez quand vous devez décider où porter l'effort d'amélioration : les délais sont trop longs, la livraison n'est pas fiable, le stock grossit, ou les projets d'amélioration atterrissent là où la voix la plus forte les envoie. La carte remplace les opinions par une image mesurée et partagée, et l'état futur transforme cette image en un petit nombre de projets à fort effet de levier.
Ne commencez pas par une VSM dans ces situations :
- Une crise sécurité, qualité ou client est en cours. Sécurisez d'abord : une semaine de cartographie ne redémarre pas une ligne à l'arrêt.
- Personne dans la salle n'a le pouvoir de changer le flux. Une carte sans sponsor finit en décoration murale.
- L'objectif est de documenter, de certifier ou de préparer une diapositive pour le COPIL. La VSM est un outil de décision ; si aucune décision n'est en attente, gardez la semaine pour autre chose.
- Vous n'arrivez pas à nommer une famille de produits. Cartographiez une famille qui compte, pas l'usine entière d'un coup.
Les termes et les indicateurs qui comptent
Ce sont les chiffres qu'une équipe de cartographie mesure et discute. Si un terme posé sur la carte ne peut pas être rattaché à quelque chose que quelqu'un a compté ou chronométré au poste, il n'a rien à faire sur la carte.
| Terme | Ce que cela veut dire sur la carte |
|---|---|
| Chaîne de valeur | Toutes les étapes, à valeur ajoutée ou non, nécessaires pour amener une famille de produits de la commande à la livraison, y compris les informations qui déclenchent chaque étape. |
| Carte de l'état actuel | Le dessin de la circulation réelle de la matière et de l'information aujourd'hui, avec des chiffres mesurés, et non telle que la décrivent l'ERP ou les procédures. |
| Carte de l'état futur | La conception du même flux après amélioration, généralement à 6 ou 12 mois. |
| Takt time | Le temps d'ouverture divisé par la demande client. Le rythme auquel le flux doit produire pour coller exactement à la demande. Exemple : 54 000 secondes d'ouverture par jour pour 456 pièces donnent un takt de 118 secondes. |
| Temps de cycle (C/T) | L'intervalle réel entre deux pièces finies qui sortent d'un processus, mesuré au poste. Noté TC ou C/T dans la boîte de données. |
| Temps de changement de série (C/O) | Le temps entre la dernière pièce bonne d'une référence et la première pièce bonne de la suivante. Des changements longs imposent de gros lots, et les gros lots fabriquent du stock. |
| Lead time | Le temps total qu'une pièce passe dans le flux, files d'attente comprises. Il se lit en jours sur la ligne de temps en bas de la carte. On dit aussi temps de traversée. |
| Ratio d'efficacité du processus | Le temps de traitement divisé par le lead time. Dans un flux jamais cartographié, il est presque toujours sous 1 %, ce qui est normal, pas honteux. |
| Supermarché et kanban | Un stock tampon maîtrisé, avec un signal qui déclenche le réapprovisionnement seulement quand quelque chose a été consommé. C'est la façon standard de remplacer le flux poussé entre deux processus qui ne peuvent pas encore s'enchaîner. |
| Processus régulateur | Le seul processus qui reçoit le programme de fabrication (le pacemaker). Tout l'amont est tiré, tout l'aval s'écoule. Un point d'ordonnancement au lieu de cinq qui se contredisent. |
| Éclair Kaizen | Le symbole en étoile qui marque, sur la carte, l'endroit où l'état futur exige un projet d'amélioration, par exemple une réduction du temps de changement de série. Les éclairs deviennent le plan d'amélioration. |
Les symboles standard, en un tableau
| Boîte processus | Une étape de transformation et sa boîte de données (C/T, C/O, disponibilité, effectif, nombre d'équipes) |
|---|---|
| Boîte de données | Les faits mesurés d'un processus, relevés au poste et non tirés des rapports |
| Triangle de stock | Le comptage de la matière en attente entre deux processus, converti en jours de demande |
| Flèche de flux poussé (hachurée) | De la matière déplacée selon un programme, que le processus suivant en ait besoin ou non |
| Supermarché | Un stock tampon maîtrisé dans lequel le processus aval vient prélever |
| Signal kanban | L'ordre de produire ou de déplacer, déclenché par la consommation |
| Camion / expédition | Les livraisons entrantes et sortantes, avec leur fréquence |
| Flux d'information | Trait droit pour le papier ou l'oral, trait en zigzag pour l'électronique (GPAO, EDI, messagerie) |
| Ligne de temps | La ligne du bas de la carte : les jours d'attente au-dessus, le temps de traitement en dessous. C'est de là que vient le lead time |
| Éclair Kaizen | Une amélioration indispensable, et une future ligne de votre liste de projets |
Mener une semaine de cartographie
Une première carte ne prend pas des mois. Elle demande une équipe préparée et environ quatre jours, et elle se termine par un plan présenté à la direction du site, pas par un dessin rangé dans un classeur. Ce déroulé a résisté au contact des vraies usines : adaptez les journées, gardez l'ordre.
| Quand | Ce qui se passe |
|---|---|
| Avant la semaine | Choisissez une famille de produits qui porte du volume ou de la marge. Nommez l'équipe : un responsable de flux, des superviseurs et des opérateurs du secteur, un ordonnanceur, une personne qui a le pouvoir de changer le flux. Réservez la salle et bloquez les agendas. |
| Jour 1, matin | Parcourez le flux de bout en bout, en partant de l'expédition et en remontant vers l'amont. On ne dessine pas encore : on regarde et on questionne. |
| Jour 1, après-midi | Refaites le parcours, chronomètre et feuille de comptage en main. Relevez les temps de cycle, les temps de changement de série, la disponibilité, les effectifs, et comptez chaque tas d'en-cours. |
| Jour 2 | Dessinez l'état actuel ensemble, sur papier ou au tableau. Flux matière de gauche à droite, flux d'information en haut, ligne de temps en bas. Discutez les chiffres jusqu'à ce que ceux qui font le travail les acceptent. |
| Jour 3, matin | Analysez : comparez chaque temps de cycle au takt, marquez toutes les flèches de flux poussé, entourez les stocks et demandez ce qui rend chacun nécessaire. |
| Jour 3, après-midi | Concevez l'état futur : où le flux continu peut-il remplacer les files d'attente, où faut-il des supermarchés pour plafonner le stock, quel processus unique reçoit le programme, quels changements de série doivent raccourcir pour permettre des lots plus petits. Marquez chaque amélioration nécessaire par un éclair Kaizen. |
| Jour 4 | Transformez les éclairs en plan d'amélioration : regroupez-les en boucles, donnez à chacune un pilote et une cible mesurable, et séquencez les 90 premiers jours. Restitution à la direction du site le jour même. |
Les règles qui gardent la semaine honnête
- Parcourez le flux avant de le dessiner, et remontez-le, de l'expédition vers la matière première, pour le voir à rebours, en partant de ce qui compte pour le client.
- Mesurez au poste. Les temps de cycle tirés de l'ERP, d'études de capacité ou de la mémoire sont le chemin le plus rapide vers une fiction.
- Comptez tous les en-cours, y compris les palettes dont personne ne veut parler, et convertissez les comptages en jours de demande pour qu'ils tombent sur la ligne de temps.
- Dessinez d'abord à la main. L'intérêt de l'état actuel, c'est une discussion partagée qui finit par un accord, et un vidéoprojecteur tue la discussion.
- Concevez l'état futur dans la même semaine, pendant que la gêne est encore fraîche. Un état actuel sans état futur est une plainte, pas un plan.
Les cinq questions de l'état futur
Concevez l'état futur en répondant à ces questions dans l'ordre. Chaque oui et chaque non devient un trait sur la carte, et chaque écart devient un éclair Kaizen.
- Quel est le takt time, et quels processus ne le tiennent pas aujourd'hui ?
- Où les processus peuvent-ils s'enchaîner pièce à pièce, sans stock entre eux ?
- Là où le flux continu n'est pas encore possible, où les supermarchés et le kanban plafonnent-ils le stock ?
- Quel processus unique devient le régulateur qui reçoit le programme ?
- Quelles améliorations (changements de série, disponibilité, implantation) doivent aboutir pour que la conception devienne réelle ?
Exemple chiffré, avec le raisonnement
Les chiffres ci-dessous sont illustratifs, mais cohérents entre eux, pour le même fabricant de composants de 450 personnes utilisé dans toute la feuille de route de transformation : une demande de 456 pièces par jour qui traverse la découpe, l'usinage, le soudage et l'assemblage, avec un programme hebdomadaire issu de la GPAO et poussé sur chaque processus. Voici ce que l'équipe a mesuré :
| Indicateur | État actuel | État futur (12 mois) |
|---|---|---|
| Lead time | 18,4 jours | 7,2 jours |
| Temps de traitement | 42 min | 38 min |
| En-cours | 8 400 pièces | 3 300 pièces |
| Changement de série (usinage) | 47 min | 18 min |
| Points d'ordonnancement | 4 processus | 1 régulateur |
| Ratio d'efficacité du processus | 0,25 % | 0,59 % |
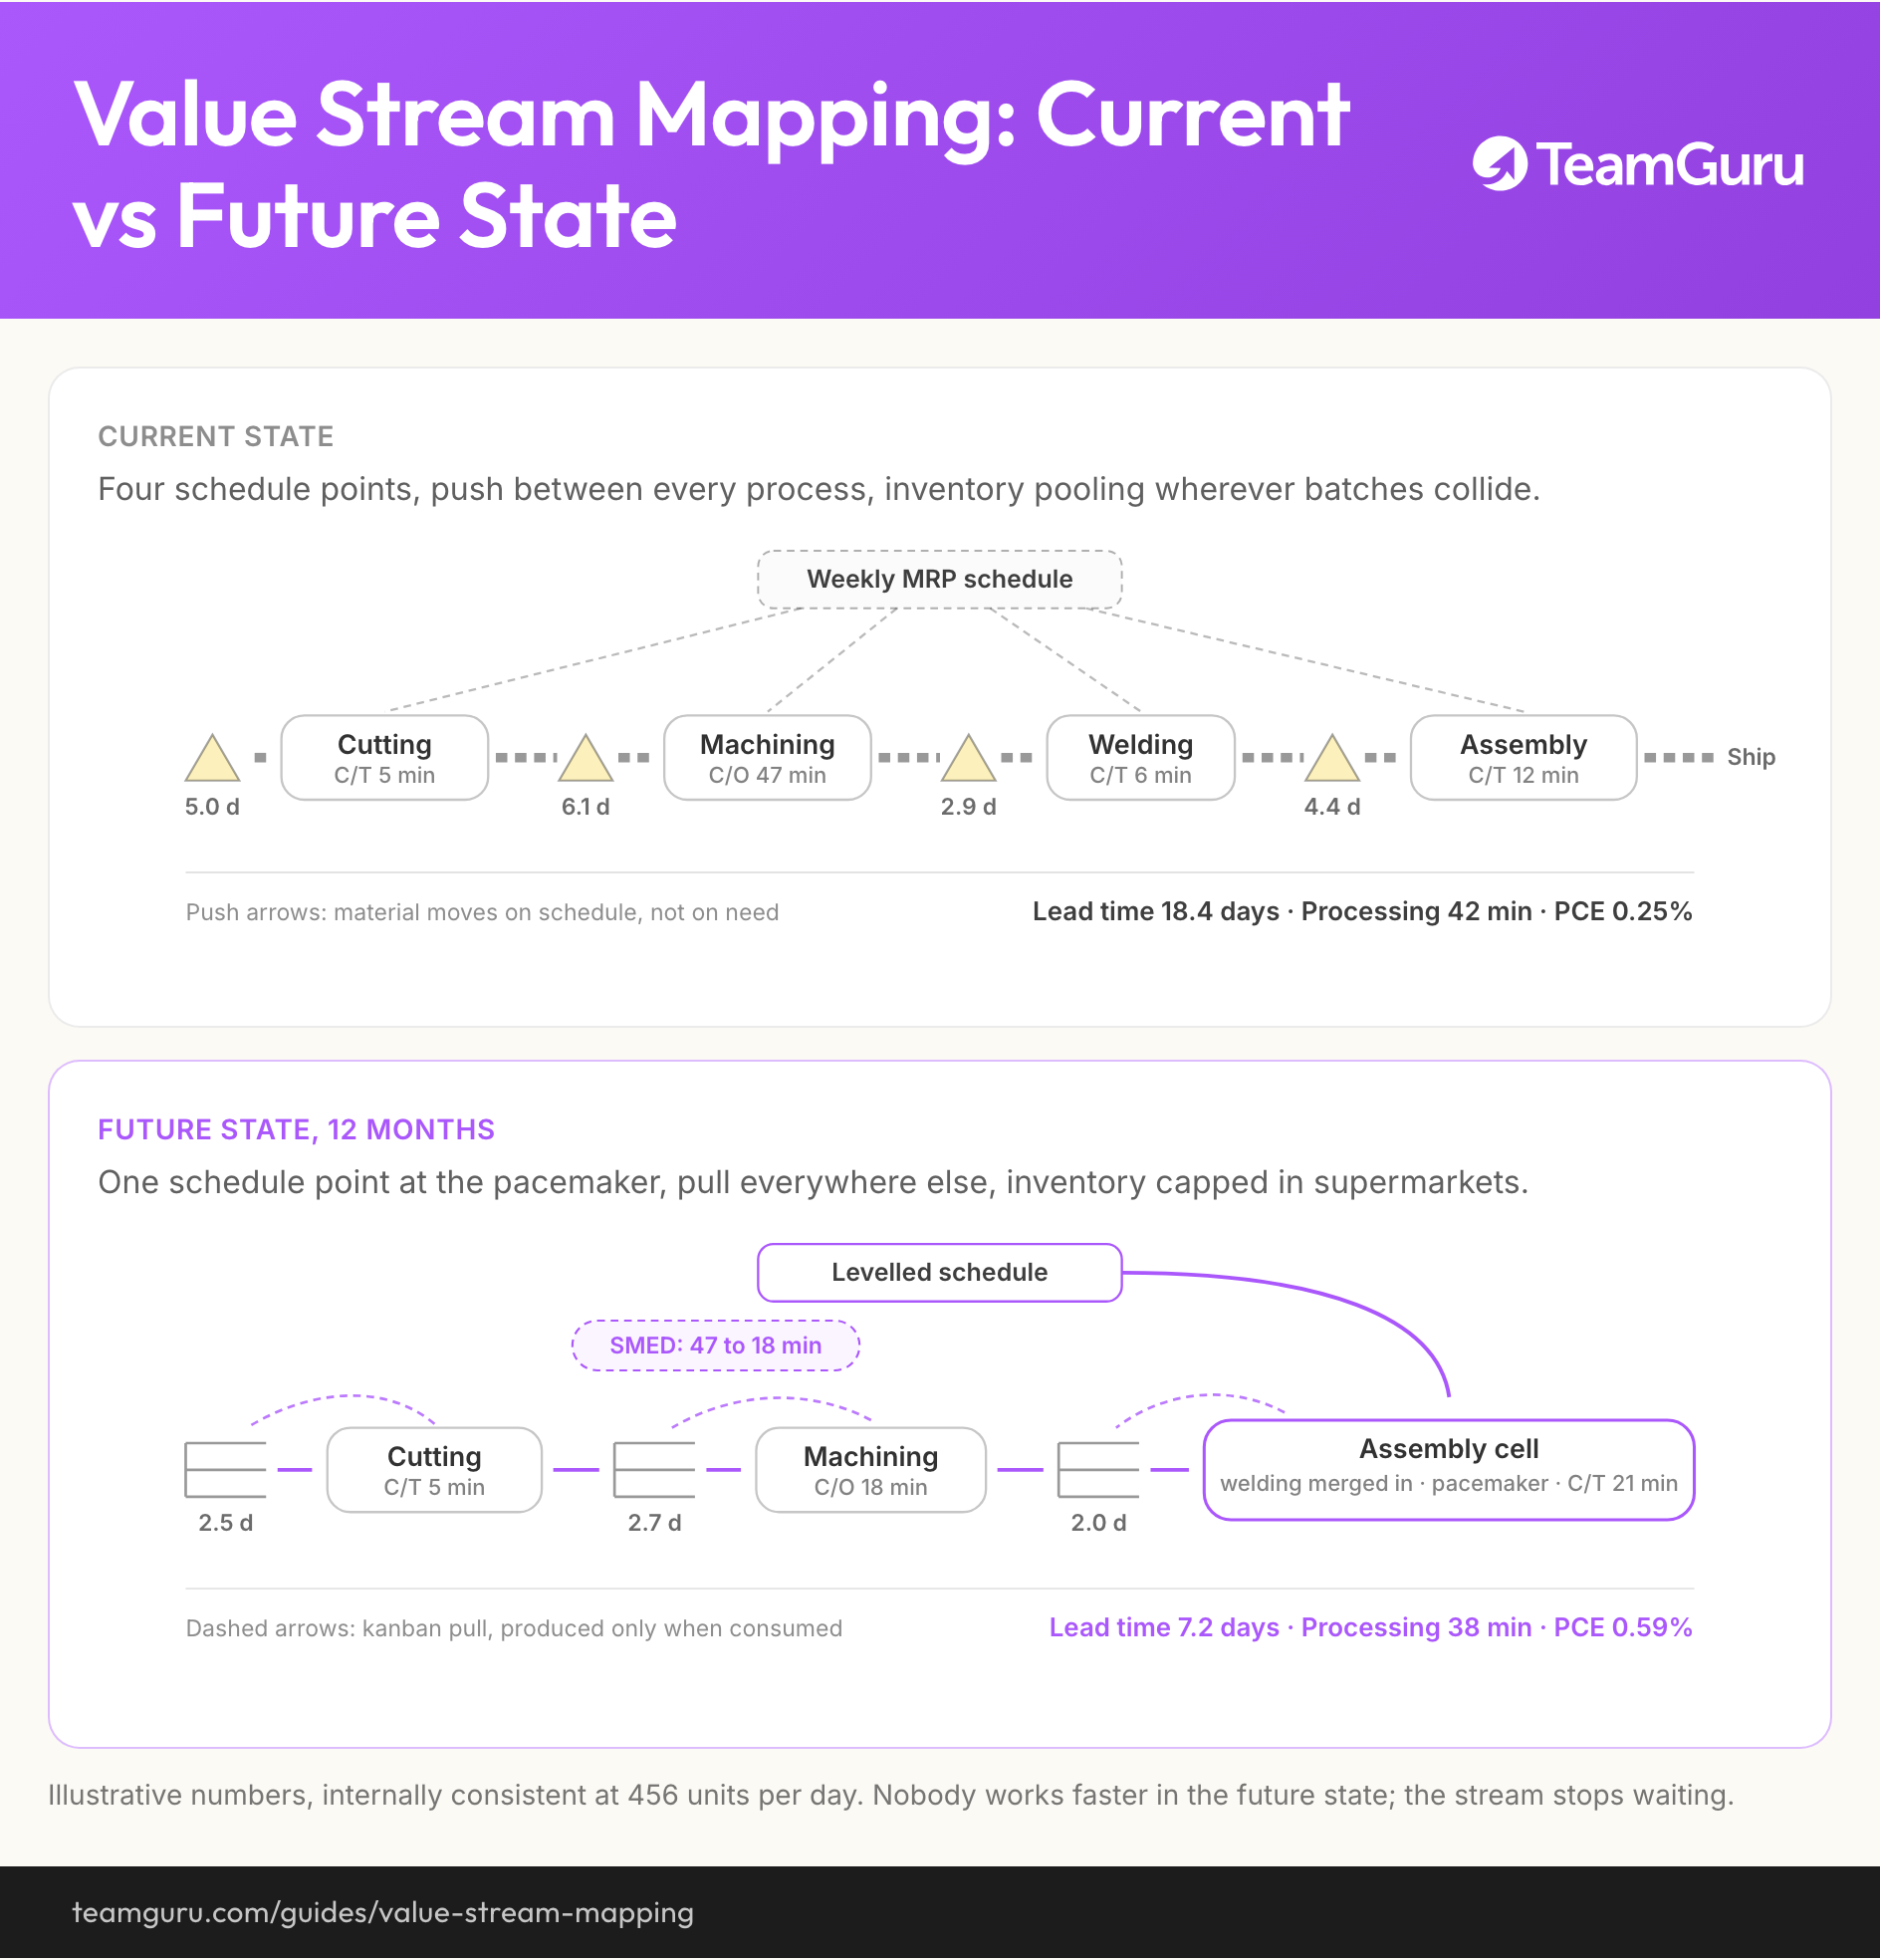
Current state
Four schedule points, push between every process, inventory pooling wherever batches collide.
Future state, 12 months
One schedule point at the pacemaker, pull everywhere else, inventory capped in supermarkets.
The implementation plan
Neither map is the deliverable. Three owned changes, sequenced over 12 months, turn the current state into the future state.
Lisez les deux premières lignes ensemble, elles portent toute la leçon : le lead time chute de 61 % pendant que le temps de traitement bouge à peine. Personne ne travaille plus vite dans l'état futur. Le flux arrête simplement d'attendre. Avec une demande de 456 pièces par jour, 8 400 pièces d'en-cours font 18,4 jours de lead time, par définition ; c'est en ramenant les en-cours à 3 300 pièces qu'on ramène le lead time à 7,2 jours. Les décisions de conception qui y mènent :
N'ordonnancer que l'assemblage final et tirer tout l'amont
Pourquoi : Quatre processus ordonnancés séparément, c'était quatre priorités concurrentes et des urgences permanentes entre elles. Un seul processus régulateur supprime partout ailleurs la discussion sur ce qu'il faut lancer maintenant.
Lancer un chantier SMED sur l'usinage (de 47 à 18 minutes)
Pourquoi : Le changement de série de 47 minutes imposait des lots d'environ trois jours de demande. Sous 20 minutes, les lots peuvent être divisés par trois, et les 6 jours de stock devant l'usinage fondent avec eux.
Installer des supermarchés avec kanban entre découpe, usinage et assemblage
Pourquoi : Le flux ne peut pas encore s'écouler pièce à pièce : les stocks restent, mais plafonnés et auto-gérés. Le stock devient une quantité voulue au lieu d'un accident.
Intégrer le soudage à l'îlot d'assemblage
Pourquoi : Le soudage tournait à la moitié du takt et alimentait une file d'attente de 2,9 jours. Le faire entrer dans l'îlot supprime un transfert, une file d'attente et un point d'ordonnancement, pour le prix d'une modification d'implantation.
Le résultat de la semaine n'a pas été la carte. C'était quatre projets avec un pilote, une cible et un séquencement sur 90 jours, plus deux KPI, le lead time et les minutes de changement de série, ajoutés à la base d'indicateurs du site pour que l'avancement soit visible chaque semaine.
Après la carte : la faire tenir
La plupart des VSM meurent dans les deux semaines qui suivent l'atelier, et toujours de la même façon : les éclairs ne deviennent jamais des projets avec un pilote, les projets n'ont jamais de rythme de revue, et six mois plus tard quelqu'un retrouve la carte derrière une armoire. Ce qui suit la carte est une chaîne de management, et chaque maillon a besoin d'un responsable :
État actuel → état futur → écarts → projets → actions → KPI → revue de direction.
La première moitié de cette chaîne, c'est la VSM. La seconde, c'est là qu'un système de management prend le relais, et là que TeamGuru gagne sa place : la carte de l'état futur et ses hypothèses vivent dans Documents, à côté du travail plutôt que sur un mur, chaque éclair Kaizen devient un projet avec des actions datées et pilotées, et le lead time et le changement de série rejoignent la base de KPI, pour que la revue mensuelle suive le flux et non le souvenir d'un atelier.
Sur la feuille de route, les étapes suivantes après la VSM sont la conception de l'état futur pour les flux prioritaires et le déploiement de la stratégie, qui transforme les plus gros écarts en quelques priorités mesurables pour le site.
Les erreurs fréquentes
Ce qui ne marche pas
- La carte est dessinée dans un bureau à partir des données de l'ERP, puis présentée au terrain
- Tous les processus de l'usine sont cartographiés d'un coup, et rien ne change
- L'état actuel est terminé ; l'état futur est reporté à un atelier ultérieur qui n'aura jamais lieu
- La carte est belle, plastifiée, et périmée depuis six mois
- Les éclairs n'ont ni pilote, ni date, ni KPI qui montrerait l'avancement
Ce qui marche
- Une famille de produits, une équipe, quatre jours, un plan d'amélioration
- Des chiffres mesurés au poste et acceptés par ceux qui font tourner le secteur
- Un état futur daté à 6 ou 12 mois, avec un takt que tout le monde sait citer
- Chaque éclair Kaizen est un projet avec un pilote et une cible mesurable
- Le lead time et le changement de série dans la base de KPI, revus tous les mois
À emporter
Le diagramme de ce guide en image, libre d'usage dans vos formations internes et vos ateliers.
Télécharger le PNG