Guide de mise en œuvre
Méthode A3.
Un A3 est un format de résolution de problèmes sur une page qui fait passer un pilote par le PDCA : la partie gauche construit la compréhension du problème, la partie droite engage les contre-mesures et leur suivi. Sa vraie force n'est pas la feuille, c'est la conversation de coaching à chaque section. Un A3 écrit seul la veille d'une revue n'est qu'un petit rapport, et la plupart des A3 ratent parce que la partie gauche a été bâclée.
Ce qu'est un A3, et à quoi il sert
Un A3 raconte la résolution d'un problème sur une seule feuille, et il tient son nom du format de papier : 297 sur 420 millimètres. Toyota a standardisé ce format non pas parce que la taille serait magique, mais parce que la contrainte l'est. Une page n'a pas la place pour tout ce qui s'est passé : le pilote doit donc trancher ce qui compte, et le lecteur voit tout le raisonnement, du problème au résultat, sans tourner de page.
La mise en page, c'est le PDCA rendu visible. La partie gauche, c'est Plan : contexte, situation actuelle, situation cible, analyse des causes racines. La partie droite, c'est Do, Check et Act : contre-mesures, plan de mise en œuvre, suivi et résultats. Lire un A3 de gauche à droite, c'est lire la pensée de quelqu'un dans l'ordre où elle aurait dû se faire. À gauche on comprend, à droite on agit, et la qualité de la droite dépend entièrement de l'honnêteté avec laquelle la gauche a été construite.
D'où l'essentiel : l'A3 est un support de coaching, pas un format de rapport. Sa force tient dans l'échange entre le pilote et son coach à chaque section : les questions posées, la vérification exigée, les retours sur le terrain entre deux séances. Un A3 écrit seul la veille de la revue contient les mêmes cases et rien de leur valeur. C'est un petit rapport. La méthode fait progresser deux choses à la fois, un problème résolu et quelqu'un qui saura mieux traiter le suivant, et c'est la seconde qui explique que Toyota ait gardé le format pendant des décennies.
La place de l'A3 dans la feuille de route de transformation
Sur la feuille de route de déploiement TeamGuru, l'A3 relève de la pratique résolution structurée de problèmes de l'étape de pilotage quotidien. Il suppose qu'un système de management quotidien existe déjà et fait remonter les problèmes plus vite que les points quotidiens ne peuvent les absorber. Sur l'échelle de la résolution de problèmes, l'A3 occupe l'échelon du milieu : plus lourd que des 5 pourquoi au pied du tableau, plus léger qu'un 8D destiné au client. Il existe pour les problèmes qui survivent à la réunion quotidienne : ceux qui traversent les équipes, reviennent pendant des mois, et ne deviennent jamais tout à fait le travail de quelqu'un.
- Avant Management quotidien
- Vous êtes ici Résolution structurée de problèmes
- Après Kaizen
- Après Obeya et revues de direction
Quel outil pour quel problème
La rigueur doit être à la hauteur de l'enjeu. Lancer un A3 sur chaque écart produit de la lassitude et des A3 superficiels ; laisser les problèmes chroniques au niveau du point quotidien produit les mêmes 5 pourquoi tous les mardis. Une règle de choix qui fonctionne :
| Outil | À sortir quand | Effort courant | Exemple |
|---|---|---|---|
| 5 pourquoi au tableau | Un problème du jour, une seule chaîne de causes, et une cause probablement visible au poste. | 30 à 60 minutes, le jour même | Un programme d'équipe non tenu par manque de matière |
| A3 | Un problème chronique qui traverse les équipes ou les services, cause inconnue, qui mérite des semaines d'attention d'un pilote. | 2 à 6 semaines, par courtes séances de coaching | Des changements de série qui dépassent le standard depuis des mois |
| 8D | Un client est touché, ou un défaut parti chez lui impose sécurisation, preuves et rapport. | Sécurisation en quelques jours, actions correctives sous 30 jours en général | Des pièces non conformes livrées à un client |
| Projet d'amélioration | La solution est déjà connue et vérifiée ; il ne reste qu'à exécuter. | Ce que le plan demande | Installer l'outillage préparé à l'avance qu'un A3 a déjà validé |
Si votre organisation conduit une démarche formelle d'actions correctives avec contrôle d'efficacité, voyez le guide RCCA : l'A3 est un bon véhicule pour l'analyse à l'intérieur d'un tel dossier, les deux sont complémentaires et non concurrents.
Comment l'écrire : la partie gauche d'abord, et lentement
L'ordre d'écriture, c'est la méthode. Les contre-mesures sont la section la plus agréable à écrire et l'endroit le plus dangereux pour commencer : une contre-mesure choisie avant d'avoir compris la situation actuelle tordra toute la partie gauche pour se justifier. Écrivez du haut à gauche vers le bas à droite, et laissez chaque section mériter la suivante. Ces règles gardent la partie gauche honnête :
- Allez voir avant d'écrire quoi que ce soit. La situation actuelle se rédige debout devant le process, pas de mémoire à un bureau. Si l'A3 porte sur les changements de série, allez regarder des changements de série.
- Des données, pas des adjectifs. Souvent, instable et trop long sont des trous en attente de mesure. Écrivez 84 changements de série à 68 minutes de moyenne contre un standard de 47 minutes, pas les changements de série débordent tout le temps.
- Dessinez la situation actuelle. Un croquis du flux avec le problème situé dessus vaut mieux que trois paragraphes de description. Si vous ne savez pas le dessiner, c'est que vous ne le comprenez pas encore.
- Faites de la cible une phrase avec un chiffre et une date. Indicateur, valeur, échéance. Tout ce qui se trouve à droite sera jugé par rapport à elle.
- Vérifiez chaque cause au poste avant qu'elle gagne sa place sur la page. Une cause validée en salle de réunion est une hypothèse, pas une cause.
- Écrivez les contre-mesures comme des expériences. Chacune répond à une cause vérifiée et annonce son effet attendu. Une prévision peut se révéler fausse, et c'est exactement ce qui donne du sens à la section suivi.
La partie droite s'écrit plus vite et se rate plus facilement. Les pilotes sont des noms, jamais des équipes ni des services. La première étape de mise en œuvre est assez petite pour démarrer cette semaine, parce qu'un plan qui commence au trimestre prochain est un plan qui ne commence jamais. Et les dates de suivi entrent dans de vrais agendas avant le démarrage, convenues avec le coach : vérifier les résultats devient un rendez-vous plutôt qu'une intention.
Le rythme de coaching
Un A3 a deux personnes attachées : un pilote proche du problème, et un coach, en général son manager ou un mentor formé. Ils se voient une vingtaine de minutes par section, au tableau ou sur le terrain, réparties sur des jours ou des semaines. Court et fréquent vaut mieux que long et rare : entre deux séances, le pilote retourne au process mesurer, observer et vérifier, et c'est là que l'analyse progresse vraiment. Huit sections passées en revue dans une réunion d'une heure, c'est une présentation, pas du coaching.
Le coach questionne et n'écrit jamais. Cela mérite d'être défendu, car c'est la règle la plus violée de la méthode. Dès que le coach prend le stylo, le pilotage change de mains : le pilote cesse d'enquêter sur le problème et se met à deviner ce que le coach veut lire, et l'A3 ne développe plus le jugement de personne. Un coach qui donne des réponses obtient de la conformité et une équipe dépendante ; un coach qui donne des questions obtient de la réflexion. Les questions sont simples et répétables : comment le savez-vous, qu'avez-vous vu, quel effet attendez-vous, comment allez-vous le vérifier. Le bénéfice est cumulatif : le deuxième A3 du même pilote demande moins de questions que le premier.
Le rythme d'un A3 est donné par la vérification, pas par l'écriture. Deux à six semaines est une durée normale pour un problème chronique, parce que confirmer une cause au poste, tester une contre-mesure et lire les résultats demande du temps de calendrier. Un A3 bouclé en un après-midi porte presque toujours une partie gauche non vérifiée, et une partie gauche non vérifiée produit une partie droite de suppositions.
Les huit sections, une par une
Chaque section répond à une question, et chaque section a sa façon classique de rater. La colonne des questions du coach sert aussi d'autocontrôle quand aucun coach n'est encore disponible : posez-la à votre propre brouillon avant que quelqu'un d'autre le fasse.
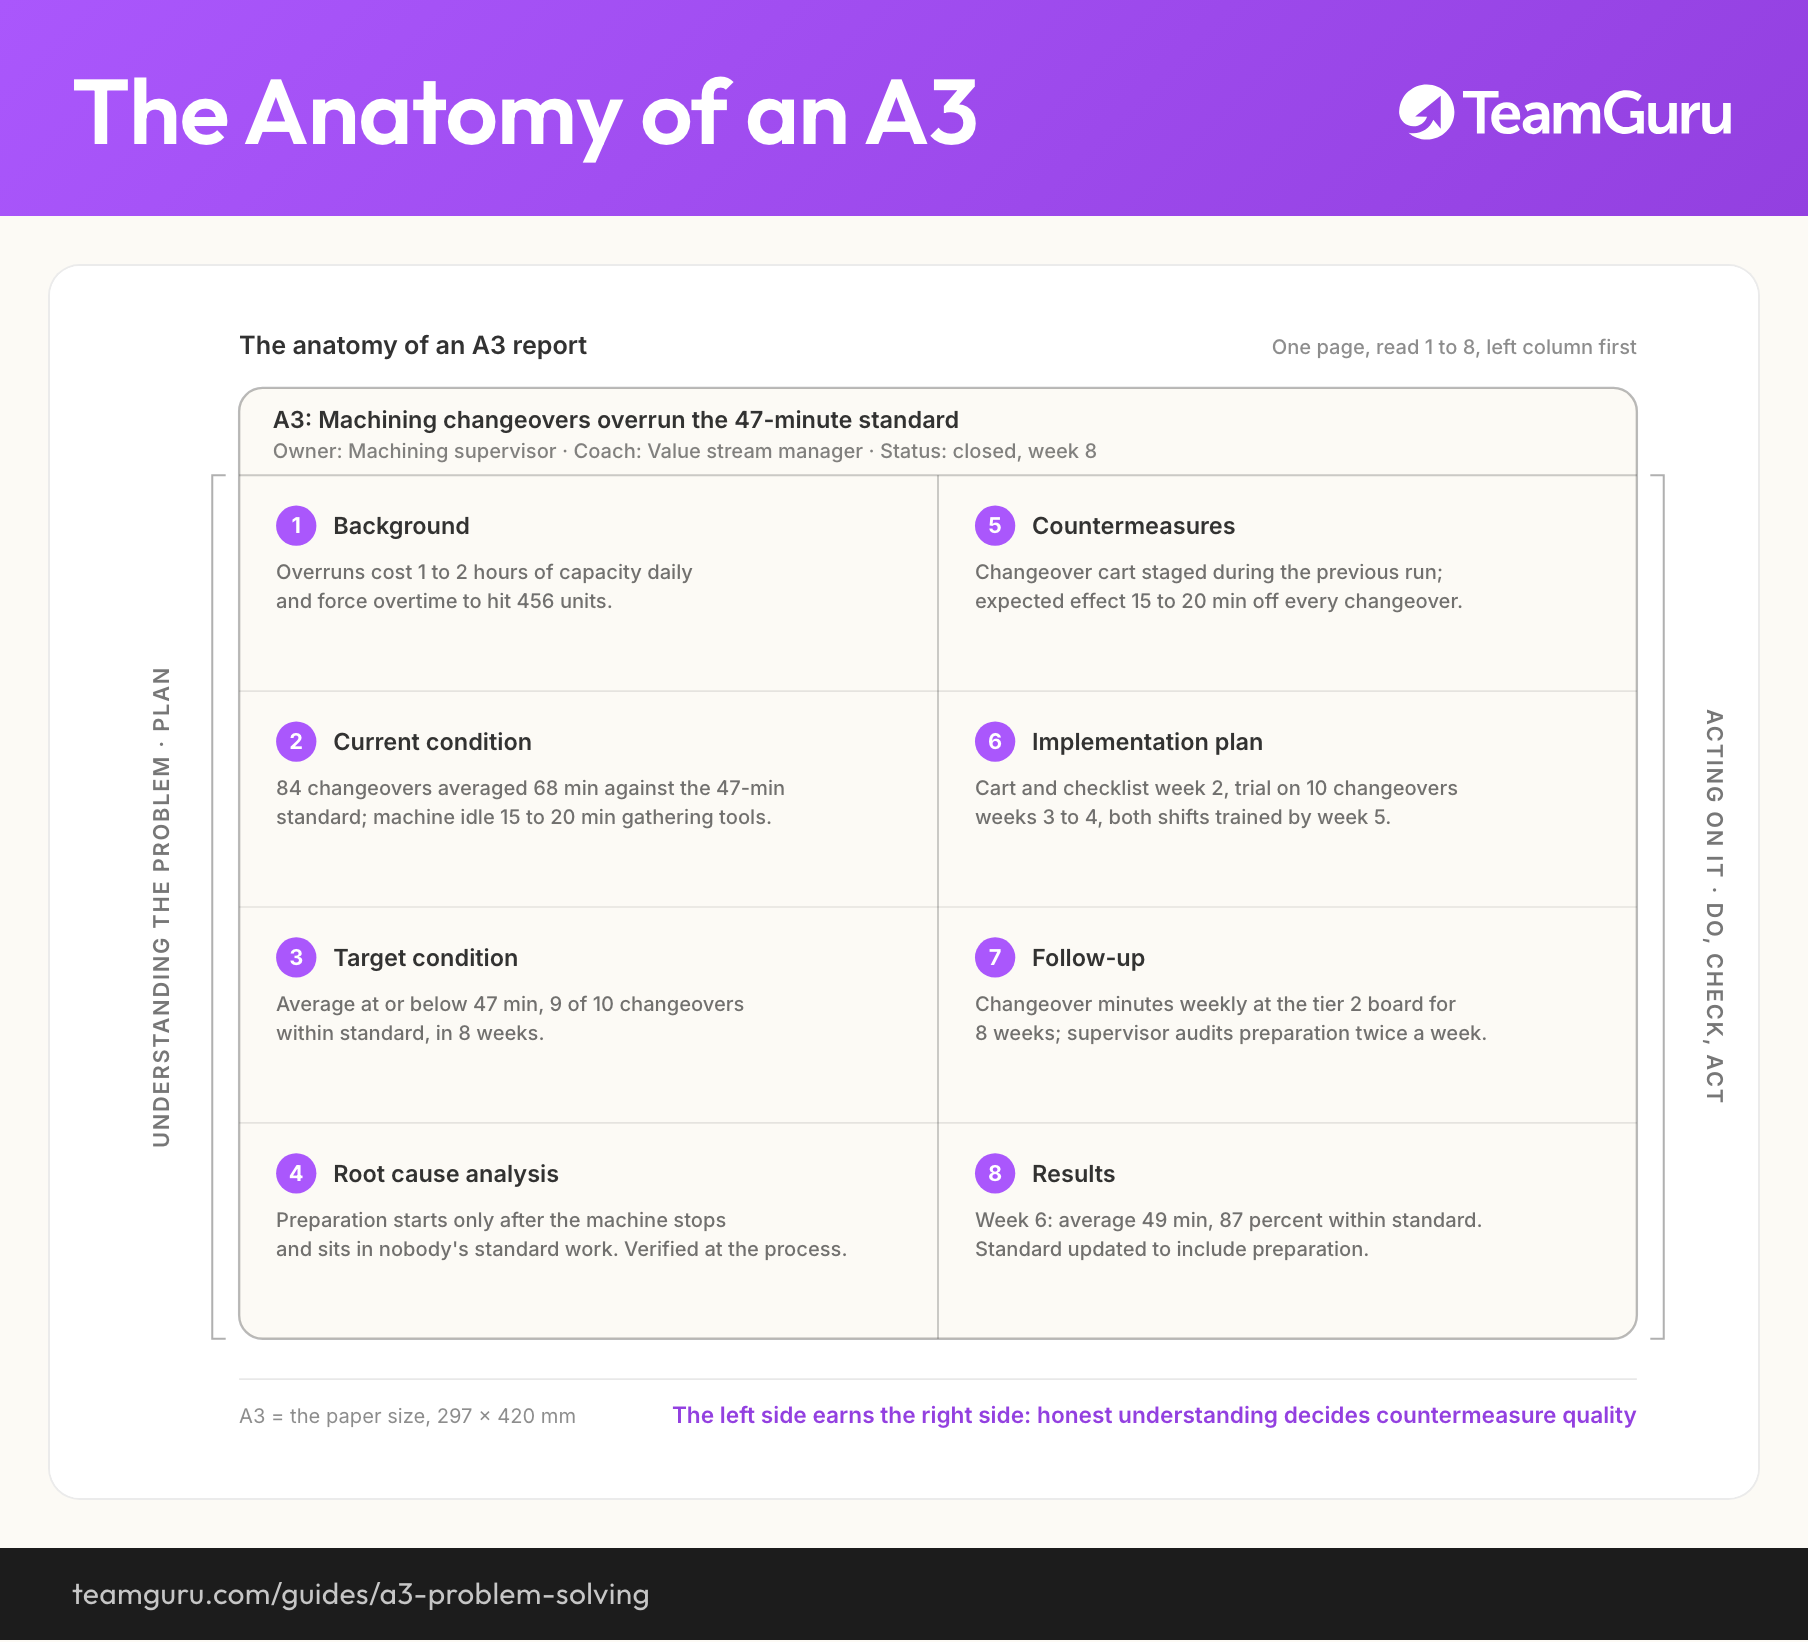
Les huit sections sur une feuille au format paysage, avec une ligne condensée de l'exemple changement de série dans chacune. Le tableau ci-dessous ajoute la question du coach et l'erreur classique pour chaque section.
| Section | La question à laquelle elle répond | Ce qui est attendu | Le coach demande | Erreur classique |
|---|---|---|---|---|
| 1. Contexte | Pourquoi ce problème compte-t-il, et pourquoi maintenant ? | Deux ou trois phrases qui relient le problème à un effet client ou économique, avec l'ampleur chiffrée. | Pourquoi quelqu'un en dehors de votre secteur devrait-il s'en soucier ? | Un cours d'histoire, ou le titre redit en plus de mots. |
| 2. Situation actuelle | Que se passe-t-il réellement aujourd'hui ? | Des données mesurées au process, un croquis simple du flux avec le problème situé dessus, et l'écart énoncé en chiffres. | Comment le savez-vous ? Montrez-moi d'où sort ce chiffre. | Des adjectifs à la place des mesures : souvent, instable, trop long. |
| 3. Situation cible | Quel résultat, de combien, pour quand ? | Un indicateur, une valeur et une date, reliés directement à l'écart de la situation actuelle. | À quoi verrons-nous que c'est réussi ? | Une direction sans chiffre, ou un chiffre sans date. |
| 4. Analyse des causes racines | Pourquoi cet écart existe-t-il ? | Des chaînes de causes vérifiées par des preuves au process, avec les 5 pourquoi ou un Ishikawa, qui aboutissent à une cause système. | Comment avez-vous vérifié cette cause, et qu'est-ce qui a écarté les autres ? | Une solution préférée déguisée en cause. |
| 5. Contre-mesures | Qu'allez-vous essayer contre chaque cause vérifiée ? | Des expériences reliées une à une aux causes, chacune avec un effet attendu et chiffré. | Quel effet prévoyez-vous, et pour quand ? | Une liste de bonnes idées sans lien avec l'analyse. |
| 6. Plan de mise en œuvre | Qui fait quoi, pour quand ? | Des pilotes nommés, des dates, et un premier pas assez petit pour démarrer cette semaine. | Qu'est-ce qui se passe en premier, et qui le fait exactement ? | Des pilotes qui sont des services et des dates qui sont des trimestres. |
| 7. Suivi | Quand et comment les résultats seront-ils vérifiés ? | Des dates de point dans de vrais agendas, l'indicateur nommé, l'instance de revue convenue. | Quand regardons-nous les données ensemble ? | Écrite une fois au début, jamais rouverte. |
| 8. Résultats | Que s'est-il vraiment passé par rapport à la cible ? | Le même indicateur que la cible, l'écart honnête, ce qui a été appris, et ce que dit le standard maintenant. | Qu'avez-vous appris, et qu'est-ce qui a changé dans le standard ? | Un succès déclaré en prose pendant que la section reste vide de chiffres. |
Un exemple rempli : l'A3 des changements de série qui débordent
Les chiffres ci-dessous sont illustratifs mais cohérents entre eux, pour le même fabricant de composants de 450 personnes utilisé dans ces guides : 456 pièces par jour, un takt de 118 secondes, un standard de changement de série à l'usinage de 47 minutes. L'A3 est condensé à une ligne par section ; un vrai A3 porte le relevé de temps d'un changement observé, les chaînes de causes et les données derrière chaque ligne. La discipline, elle, est la même.
A3 : les changements de série à l'usinage dépassent le standard de 47 minutes
Pilote : responsable usinage
Coach : responsable de flux
Statut : clos, semaine 8
Côté gauche : comprendre (Plan)
1. Contexte
L'usinage alimente l'assemblage à un takt de 118 secondes, avec 4 à 6 changements de série par jour. Les dépassements coûtent une à deux heures de capacité par jour et imposent des heures supplémentaires pour tenir les 456 pièces.
2. Situation actuelle
84 changements de série mesurés le mois dernier : 68 minutes de moyenne contre un standard de 47 minutes. Le chronométrage de 12 d'entre eux montre la machine à l'arrêt les 15 à 20 premières minutes, le temps de rassembler outils, montages et programmes.
3. Situation cible
Changement de série à 47 minutes ou moins en moyenne, avec 9 changements sur 10 dans le standard, en 8 semaines.
4. Analyse des causes racines
La préparation ne fait pas partie du standard de changement de série : rassembler outils, montages et programmes ne commence qu'une fois la machine arrêtée, et la préparation ne figure dans le travail standardisé de personne. Vérifié en observant cinq changements de bout en bout.
Côté droit : agir (Do, Check, Act)
5. Contre-mesures
Préparer un chariot de changement de série avec les outils, le montage et les moyens de contrôle de la première pièce pendant la dernière heure de la série précédente, guidé par une check-list de préparation externe. Effet attendu : 15 à 20 minutes de moins sur chaque changement.
6. Plan de mise en œuvre
Le régleur et le superviseur construisent le chariot et la check-list en semaine 2, essai sur 10 changements en semaines 3 et 4, formation des deux équipes pour la semaine 5. La préparation entre dans le travail standardisé du régleur.
7. Suivi
Minutes de changement de série passées en revue chaque semaine au tableau AIC niveau 2 pendant 8 semaines ; le superviseur audite la préparation deux fois par semaine.
8. Résultats
Semaine 6 : 49 minutes de moyenne, 87 % dans le standard. Deux dérives tracées jusqu'à un montage partagé avec une autre ligne, désormais planifié. Standard mis à jour pour intégrer la préparation.
Exemple illustratif. Un vrai A3 attache derrière chaque ligne les relevés d'observation et les croquis.
Deux choses méritent d'être copiées dans cet exemple. La contre-mesure vise la cause système, la préparation qui ne figure dans le travail standardisé de personne, et non l'application du régleur. Et le dossier se termine par un standard modifié plus un passage de relais : une fois les changements de série revenus de façon fiable à 47 minutes, ramener le standard lui-même de 47 à 18 minutes est devenu un chantier SMED avec une base stable d'où progresser. Un A3 qui rétablit le standard et un projet qui l'améliore sont deux métiers différents, et les confondre coule les deux.
Les erreurs courantes
Les démarches A3 échouent rarement bruyamment. Elles s'éteignent doucement, dans le remplissage du modèle : les cases sont remplies, les revues sont tenues, et rien ne change dans la façon dont l'usine raisonne.
Le mauvais A3
- Le modèle est rempli, dans l'ordre, d'une traite, la veille de la revue
- Le service amélioration continue rédige les A3 que les managers viennent ensuite présenter
- La partie droite est écrite en premier et la partie gauche reconstruite pour la justifier
- Les sections suivi et résultats restent vides pour toujours, et personne ne le remarque
- Dix A3 ouverts par pilote, aucun qui avance
Le bon A3
- Un pilote, un coach, une page, un problème qui mérite des semaines d'attention
- Une situation actuelle bâtie sur des données mesurées au process, avec un dessin
- Chaque contre-mesure répond à une cause vérifiée et annonce son effet
- Les dates de suivi sont dans les agendas et produisent des résultats écrits honnêtement
- L'A3 clos se termine par un standard modifié, pas seulement par un dossier fermé
Après l'A3 : faire tenir les contre-mesures
Une contre-mesure vérifiée est une découverte sur la façon dont le process devrait tourner, et elle ne survit que si le standard change avec elle. Le dernier acte d'un vrai A3 est de mettre à jour le travail standardisé et de former au changement, pour que le prochain audit contrôle la nouvelle méthode et non l'ancienne. Les contre-mesures qui ont fait leurs preuves dans un secteur sont aussi la matière première du système d'amélioration : une solution qui mérite d'être gardée mérite en général d'être diffusée.
La pensée A3 monte aussi en niveau. La même discipline, la gauche avant la droite, qui traite un problème de changement de série porte les sujets stratégiques à l'échelle du site, et c'est pourquoi le Hoshin Kanri est souvent décrit comme la pensée A3 appliquée à l'année. Une équipe de direction qui coache bien les A3 déploie en général bien sa stratégie, parce que les deux habitudes n'en font qu'une : comprendre avant d'agir.
Entre deux séances de coaching, ce qui casse en pratique, c'est la mémoire : qui devait quoi, quelles données devaient être relevées, quand tombait le point de suivi. C'est là que les équipes qui font tourner la méthode en numérique utilisent TeamGuru : le cas d'usage analyse des causes racines tient les chaînes, les preuves et les contre-mesures dans un seul dossier, et les actions portent les pilotes et les échéances de la partie droite, pour que le suivi arrive à une date plutôt qu'au souvenir de quelqu'un. La page reste une page ; le système autour cesse de fuir.
À emporter
Le diagramme de ce guide en image, libre d'usage dans vos formations internes et vos ateliers.
Télécharger le PNGQuestions fréquentes
Pourquoi appelle-t-on cela un A3 ?
Quelle différence entre un A3 et un 8D ?
Combien de temps doit durer un A3 ?
Qui doit piloter un A3 ?
Faut-il faire les A3 sur papier ou dans un logiciel ?
Le format A3 sert-il à autre chose qu'aux problèmes ?
Comment TeamGuru le met en pratique