Implementation Guide
OEE.
Overall equipment effectiveness (OEE) measures how much of a machine's planned production time turns into good product, as availability times performance times quality. Its value is the loss breakdown behind the score: breakdowns, changeovers, minor stops, slow cycles and rejects, each pointing at a specific countermeasure. Benchmark one line against its own trend, not plant against plant; definitions vary too much for cross-plant comparison to mean anything.
What OEE is, factor by factor
Overall equipment effectiveness multiplies three fractions. Availability: of the time production was planned, how much did the machine actually run? Performance: while it ran, how close did it come to its ideal cycle time? Quality: of what it produced, how much was good the first time? The product of the three is the share of planned production time that became good product at full speed.
Each factor catches a different family of loss, and that is the design. Availability catches the stops big enough to log: breakdowns and changeovers. Performance catches what the log misses: reduced speed and the stops too short to record. Quality catches scrap and rework, including the startup pieces after every changeover. Nothing escapes the triad, because anything that is not fully productive time lands in exactly one factor. That is what makes OEE useful: it does not just say how much was lost, it says where to look.
Which is also the right way to hold the number. OEE is a pointing instrument, not a score. Used as a score, it invites exactly the definition games that make it worthless; used as a loss finder, it tells a plant precisely which project to fund next. This page treats it as the second thing.
Where OEE sits in the transformation roadmap
On the TeamGuru deployment roadmap, OEE belongs to the equipment and methods practice in the Improve stage. It is the measurement backbone that SMED, TPM and error-proofing projects aim at, and the scoreboard that shows whether they worked. It assumes a daily rhythm underneath: losses are captured shift by shift and reviewed at the area's daily performance board, not assembled monthly for a slide.
- Before Daily Management
- You are here SMED, TPM, FMEA & Poka-Yoke
- In parallel Kaizen
- After Obeya & Management Reviews
When OEE misleads
OEE fails in predictable ways, and all of them look like success on a dashboard:
- On non-constraint machines, a rising OEE usually measures overproduction. A recovered hour on the constraint is an hour of output for the whole stream; a recovered hour anywhere else just builds inventory faster. Put OEE on the constraint and near-constraints, and let the rest of the plant live with simple downtime tracking.
- An inflated ideal cycle time flatters performance. If the ideal is set to the budgeted speed instead of the fastest demonstrated cycle, performance improves without anything changing at the machine.
- Averages hide everything. A plant-level OEE is an average of averages: it drifts a point a month, nobody can act on it, and one line's breakthrough disappears into another line's bad week. Keep the number per line, per shift.
The ideal cycle deserves the strongest rule, because it is the quietest lever. Lock it at the fastest repeatable cycle the process has ever demonstrated, write it next to the definitions, and change it only when the process itself genuinely changes, with a dated note on the trend. An ideal you can negotiate is not an ideal, it is a target, and targets drift toward comfort.
The same logic is why cross-plant benchmarking rewards creative counting. Two plants that differ on what counts as planned downtime, where minor stops land and how rework is counted can differ by fifteen OEE points while running identically. The comparison that cannot be gamed is one line against its own trend, computed the same way, month after month.
Measurement people actually trust
An OEE program stands or falls on whether the people at the machine believe the number and feel safe feeding it. The mechanics are simple; the discipline is the work:
- Write the definitions once. What counts as planned downtime, the threshold above which a stop gets logged, where minor stops land, what counts as a defect, and whether rework is good output (it is not). One page, agreed by production and maintenance together, posted at the machine. Every future argument about the number is settled by pointing at this page.
- Capture per shift, at the process. The operator logs stops with a reason code as they happen, on paper or a terminal at the machine. A supervisor reconstructing the day at 6 pm from memory and the ERP produces a smoother, prettier and largely fictional dataset.
- Keep the reason codes short. A dozen codes beat eighty. If "other" carries more than a tenth of the minutes, the code list is wrong; fix the list instead of lecturing people about discipline.
- Treat minor stops honestly. Stops below the logging threshold do not disappear, they surface as a lower performance factor. Say that out loud when you introduce the metric, so nobody is surprised that performance runs well below 100 even on a day without drama.
- Review it at the daily board. Yesterday's OEE and its top loss belong on the area's daily performance board, next to safety, quality and delivery. The number earns its collection cost only when a bad day becomes an action with an owner the next morning.
- Never grade people with it. The moment OEE touches a bonus or an individual scorecard, every definition becomes a negotiation and every gray case gets rounded toward green. OEE measures the system: the machine, the method, the schedule and the material. The crew is the source of the data, and the data survives only as long as reporting a loss is safe.
The worked calculation, step by step
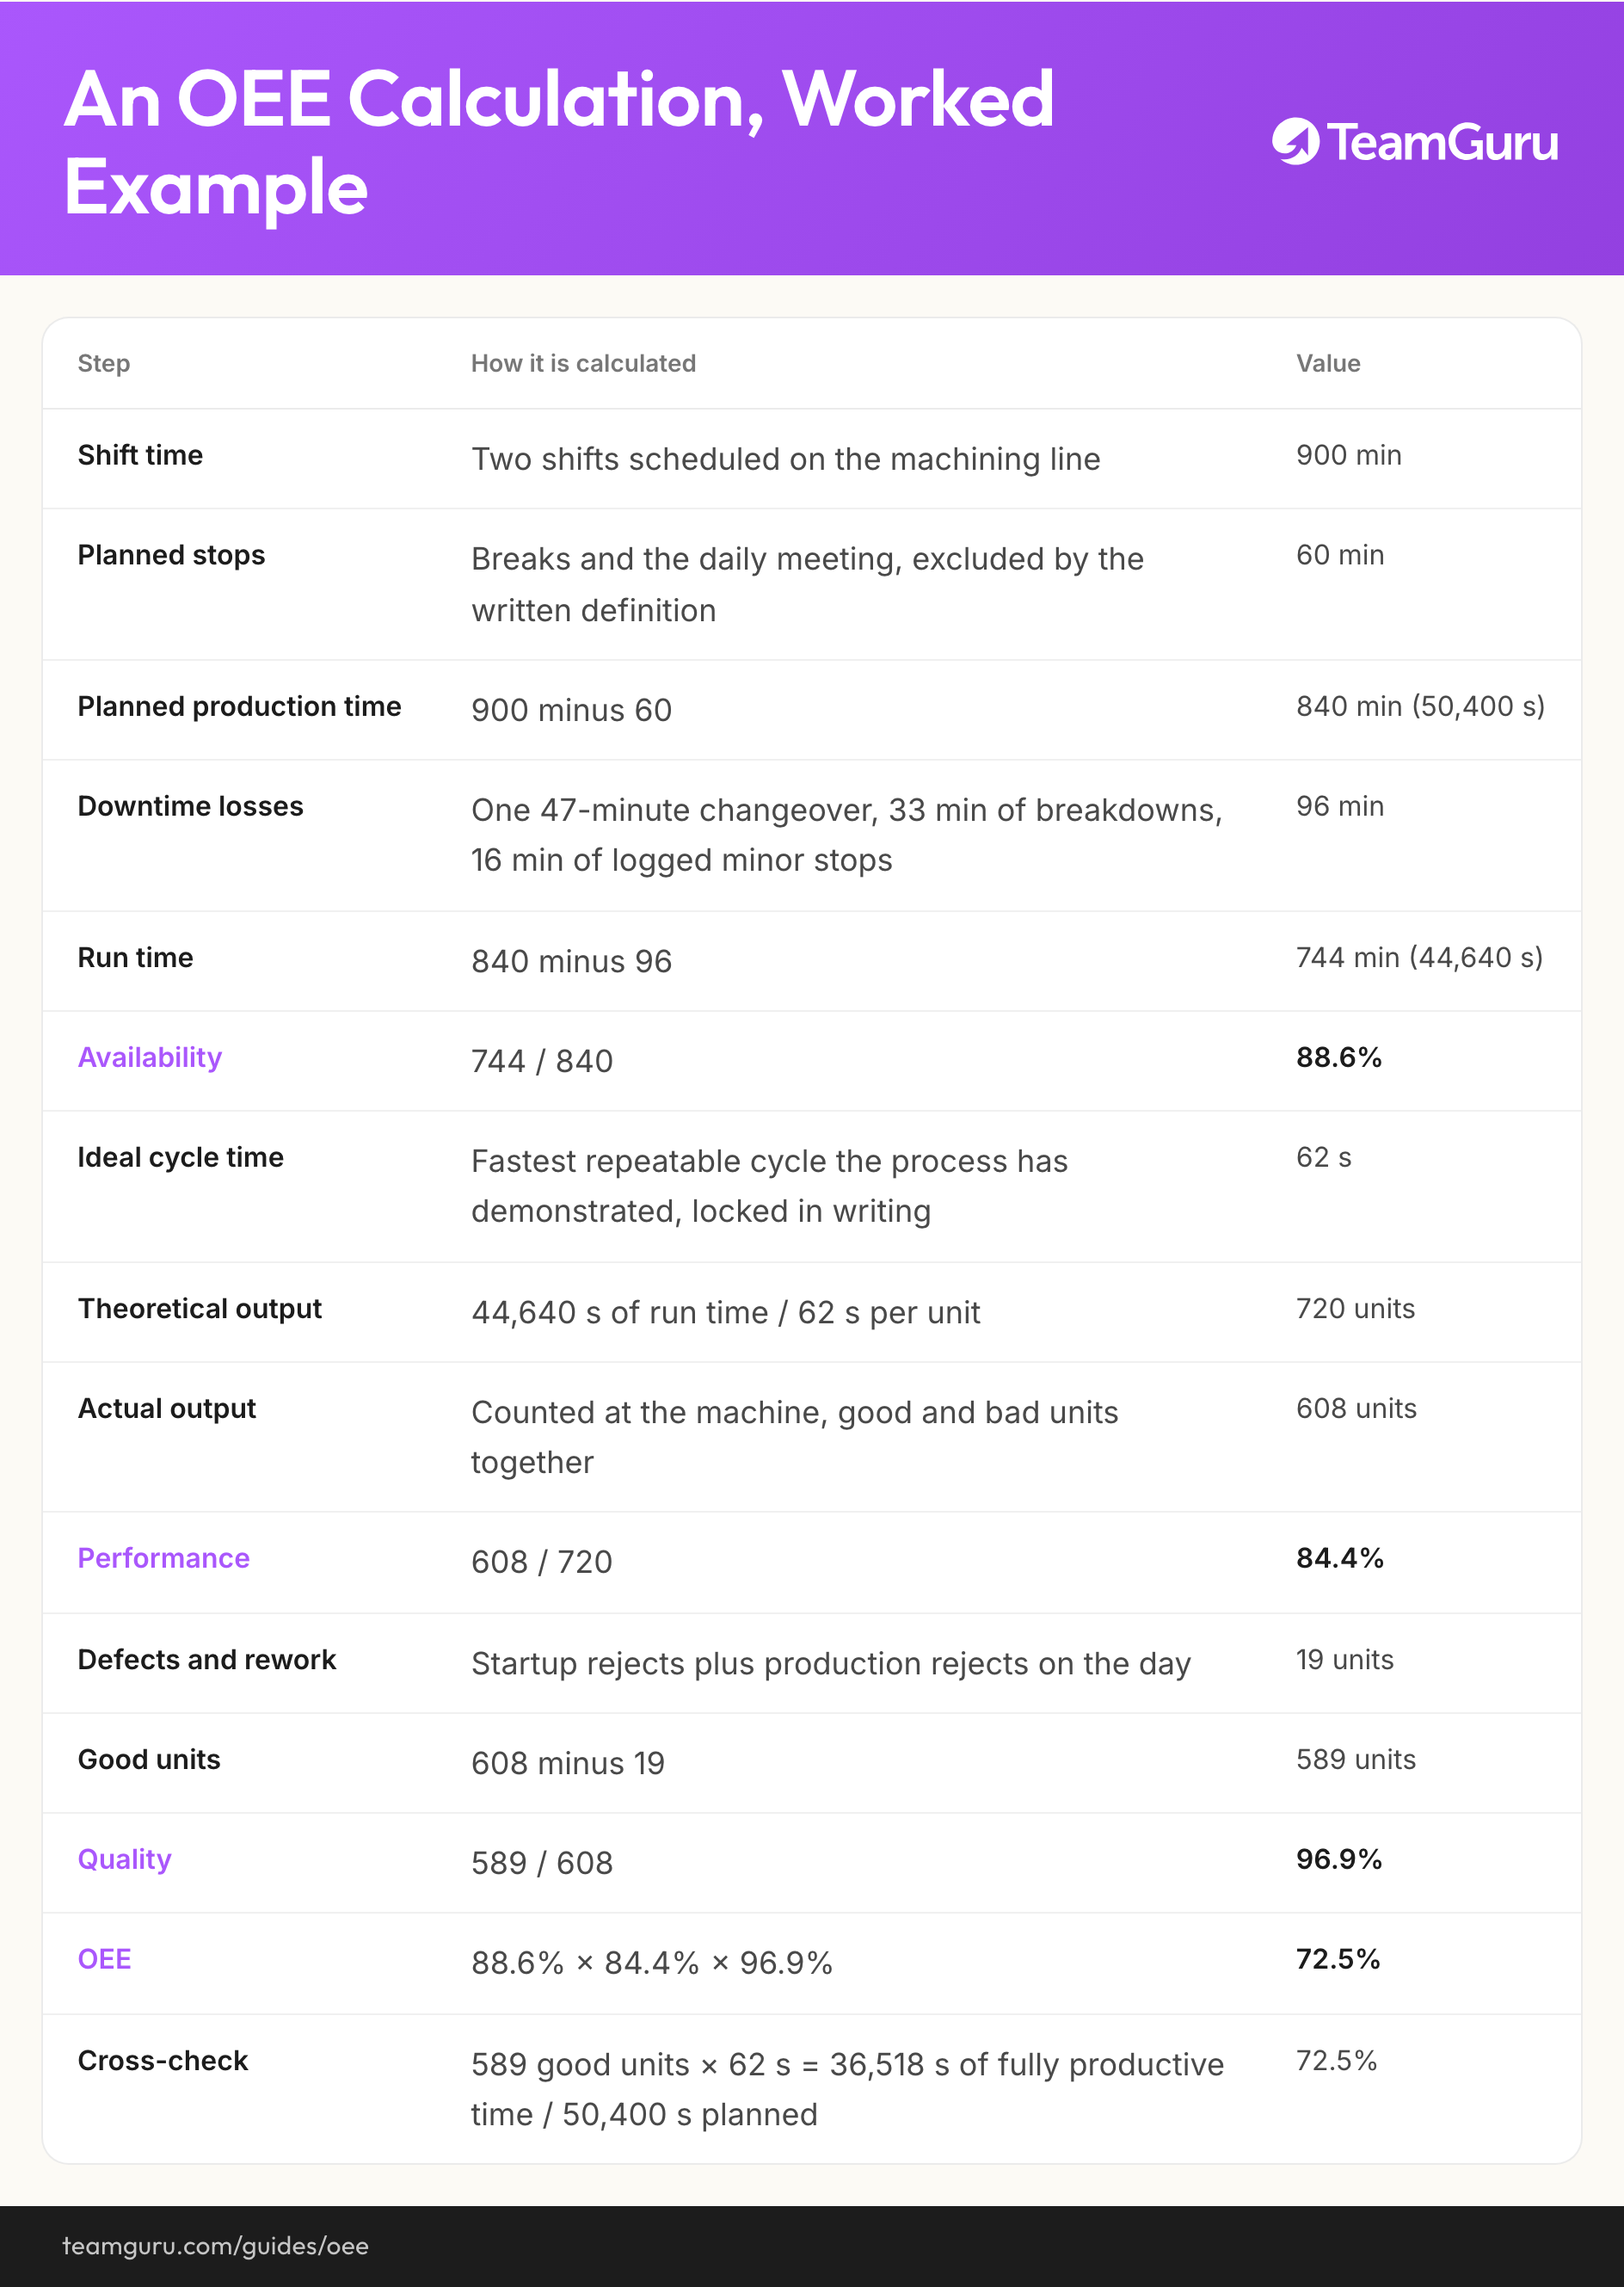
The numbers are illustrative but internally consistent, for the 450-person components manufacturer used across the transformation roadmap: 456 finished units per day of demand, two shifts. This is one day on its machining line, the same line whose 47-minute changeover the plant's value stream map marked for reduction. The line machines components for two product families, so its daily plan runs well above final assembly's 456 units, at an ideal cycle of 62 seconds.
| Step | How it is calculated | Value |
|---|---|---|
| Shift time | Two shifts scheduled on the machining line | 900 min |
| Planned stops | Breaks and the daily meeting, excluded by the written definition | 60 min |
| Planned production time | 900 minus 60 | 840 min (50,400 s) |
| Downtime losses | One 47-minute changeover, 33 min of breakdowns, 16 min of logged minor stops | 96 min |
| Run time | 840 minus 96 | 744 min (44,640 s) |
| Availability | 744 / 840 | 88.6% |
| Ideal cycle time | Fastest repeatable cycle the process has demonstrated, locked in writing | 62 s |
| Theoretical output | 44,640 s of run time / 62 s per unit | 720 units |
| Actual output | Counted at the machine, good and bad units together | 608 units |
| Performance | 608 / 720 | 84.4% |
| Defects and rework | Startup rejects plus production rejects on the day | 19 units |
| Good units | 608 minus 19 | 589 units |
| Quality | 589 / 608 | 96.9% |
| OEE | 88.6% × 84.4% × 96.9% | 72.5% |
| Cross-check | 589 good units × 62 s = 36,518 s of fully productive time / 50,400 s planned | 72.5% |
Illustrative day. The cross-check row is worth keeping in your own template: if good units times ideal cycle over planned time disagrees with the three-factor product, a definition has drifted somewhere.
Now read the day as minutes instead of percentages, because that is where the projects hide. Of 840 planned minutes, the line lost 96 to logged downtime, roughly 116 more to slow cycles and stops too short to log, and about 20 minutes producing the 19 units that failed inspection. What remains is 609 minutes of fully productive time, and 609 over 840 is the same 72.5 percent.
The uncomfortable finding is that the biggest single bucket, those 116 performance minutes, is the one with no reason codes attached. That is typical, and it is an instruction: before launching anything, spend a week logging micro stops manually or lowering the capture threshold, so the biggest bar on the Pareto stops being a mystery. Among the named losses, the 47-minute changeover leads, which is why this line's first funded project is SMED, targeting the 18 minutes its future-state map already assumes.
The six big losses, and what counters each
Every OEE loss belongs to one of six classic families, and each family has a known counter-method. This mapping is what turns a measurement into a program: the monthly Pareto names the family, the family names the method.
| Loss | Factor it hits | What it looks like at the machine | Counter-method |
|---|---|---|---|
| Breakdowns | Availability | Unplanned stops above the logging threshold: seized bearings, broken tooling, waiting for maintenance | TPM |
| Changeovers and setups | Availability | Last good unit of one product to first good unit of the next, adjustments and trial pieces included | SMED |
| Minor stops and idling | Performance, unless logged | Jams, sensor trips, misfeeds, a nozzle wiped clean: seconds each, dozens a shift, rarely recorded | TPM |
| Reduced speed | Performance | Cycles slower than the ideal: worn tooling, feeds dialed down after a scare, method differences between operators | Standardized work , TPM |
| Startup rejects | Quality | Scrap and rework until the process stabilizes after a changeover or a cold start | SMED , Standardized work |
| Production rejects | Quality | Scrap and rework in steady-state running, caught at the machine or downstream | RCCA , Poka-yoke |
Where minor stops land depends on your capture threshold: logged, they count against availability, as on the example line; unlogged, they surface in performance. Either is fine. Deciding once and writing it down is what matters.
The working rhythm is monthly: Pareto the losses per constraint line, take the top bar, and either launch a project against it or resize the one already running. On the example line that means a SMED project for the changeover, autonomous maintenance from the TPM guide for breakdowns and minor stops, and a micro-stop study before touching performance. Resist the urge to attack all six families at once; the Pareto exists so you do not have to.
What good and bad look like
What bad looks like
- OEE on individual scorecards, so every input bends toward green
- Chasing 85 percent because a conference slide called it world class
- One plant-wide average, refreshed monthly, with no loss breakdown behind it
- Planned downtime redefined mid-year so availability improves while output does not
- Ideal cycle time set to the budget speed, or quietly raised after a good week
What good looks like
- Definitions on one page at the machine, changed only with a dated note on the trend
- OEE on the constraint, per shift, reviewed at the daily board
- Ideal cycle locked to the fastest repeatable demonstrated cycle
- A monthly loss Pareto that launches, resizes or kills improvement projects
- The line's trend against itself, quarter over quarter
From the number to the improvement pipeline
An OEE trend nobody acts on is a diary of losses. The chain that makes it worth collecting runs: shift capture, daily board review, monthly loss Pareto, funded countermeasure, standard that holds the gain. The Pareto's top bars become entries in the plant's improvement pipeline with owners and verification dates, and the OEE trend joins the plant's KPI baseline next to lead time and first pass yield, so the monthly review can see whether the projects moved the machine or just the paperwork.
This is also where OEE stops being a spreadsheet hobby. In TeamGuru, the line's OEE and its loss reasons live as KPIs attached to the daily boards, so yesterday's downtime is already coded when the monthly Pareto is drawn, and the SMED or TPM project it triggers carries its own actions, owners and review rhythm instead of a folder of exports.
One honest closing rule: improve the losses, and let the score follow. A plant that manages the Pareto gets a rising OEE as a side effect. A plant that manages the OEE gets rising definitions.
Take this with you
The diagram from this guide as a shareable image, free to reuse in internal training and workshops.
Download PNGFrequently asked questions
What is a good OEE score?
How is OEE different from utilization?
What counts as planned downtime in OEE?
Should every machine have an OEE number?
What is the difference between TEEP and OEE?
Can OEE be gamed?
How TeamGuru runs this