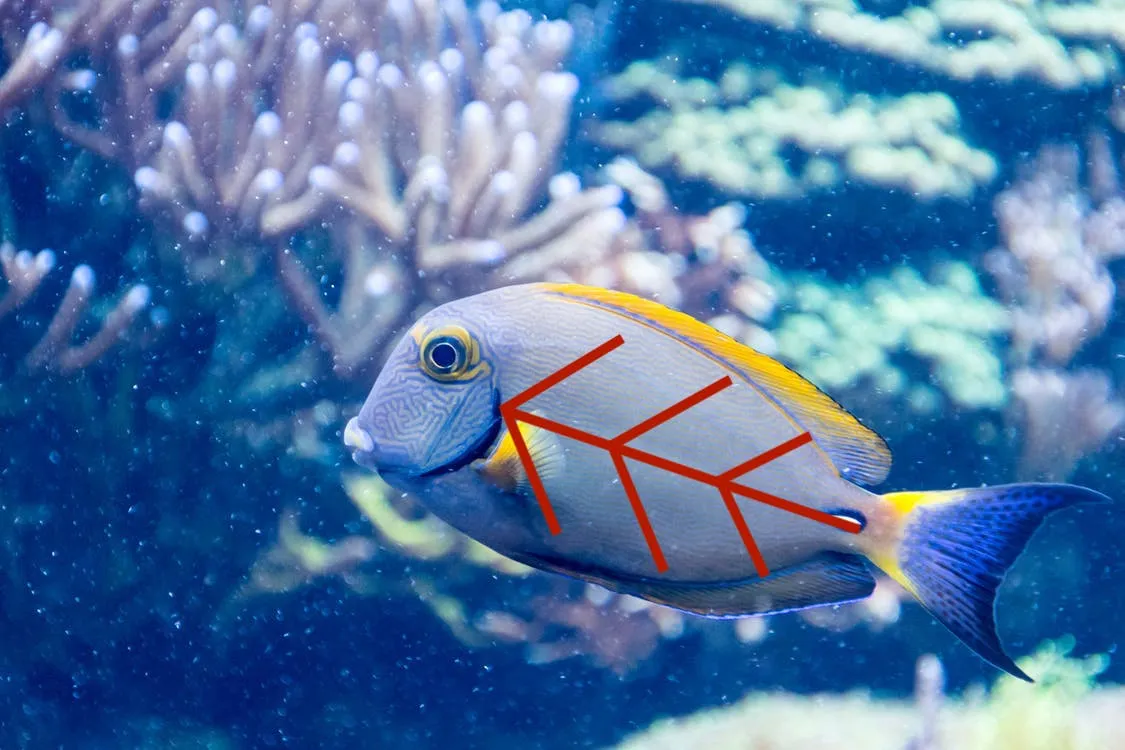
There are different tools that can be used when trying to find out the real root-cause of a problem. One of the very effective ones is called a Fishbone Diagram (Also known as: Cause–and–Effect Diagram, Ishikawa Diagram or 6M Analysis).
Using the diagram you can quickly identify the problem causes and group them into major categories to identify / classify these sources of abnormalities.
And herewith the good news!
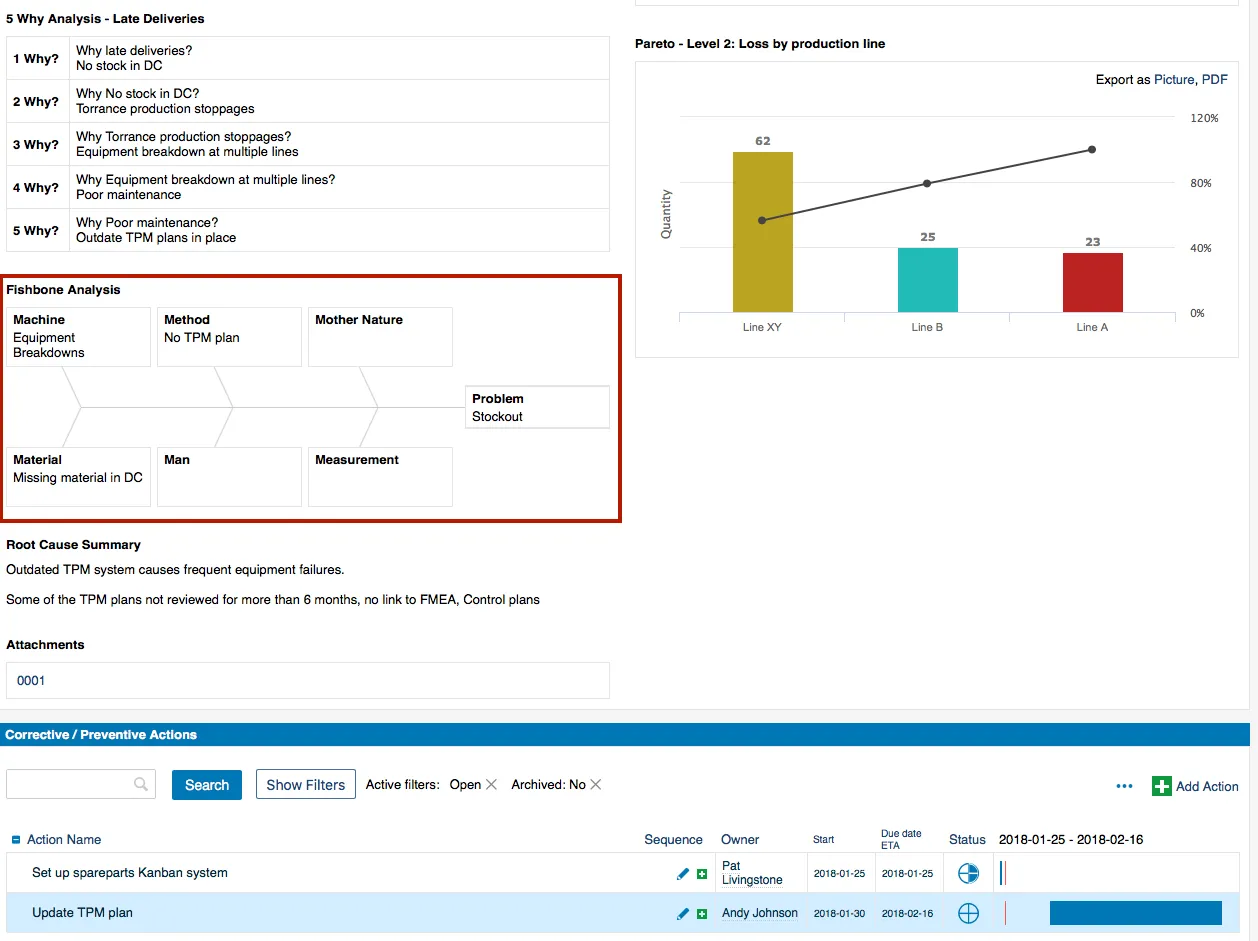
We have incorporated the Fishbone analysis directly into TeamGuru’s RCCA module to your full advantage.
How to do a Fishbone Analysis
- Brainstorm all possible causes of the problem
- Don't forget to consider all basic (6M) potential sources of the problem:
Man
Machine
Method
Material
Measurement
Mother Nature
- Prioritize the identified causes and decide which ones need a follow-up
That's it. Now you have even more analytical tools (available right in TeamGuru) that can be used when fixing a problem.
"We work hard to provide an extraordinary leadership management tool to our clients; therefore, we never stop learning, growing and changing in efforts to make our service even greater.”
- Pavel Humlíček, TeamGuru CEO
About the author

Pavel Humlicek
Co-founder & CEO of TeamGuru, with a background in Lean management consulting. Pavel reviews TeamGuru's management-system and operational-excellence content for practical accuracy and applicability.