

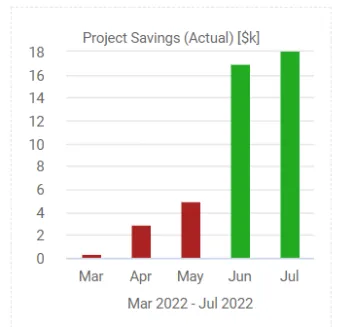
Outline the total of your projects
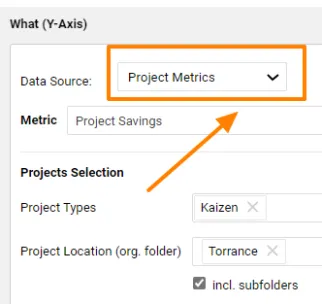
Do you need to show summarized metric data for a group of projects in your Report?
Go to your chart widget, select project metrics as your data source, and choose additional criteria.

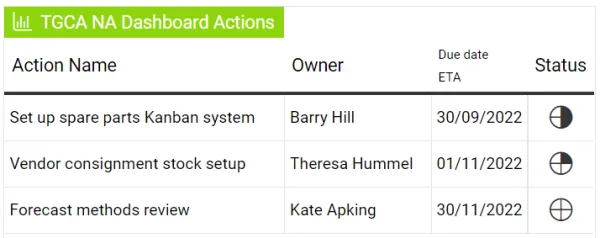
Include your dashboard actions
Would you like to review your dashboard actions concisely in one report?
Select your dashboard as a source document in the Action widget & display your actions.
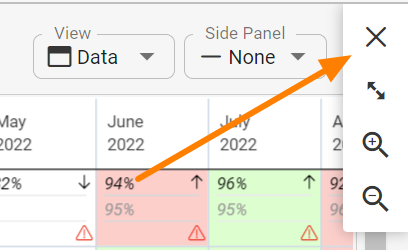
Zoom into your dashboard's view
Check out new upgrades to our recently added functionality.
Switch to a full-screen presentation mode or zoom in & out as needed. Just hover over the X icon to see the options.
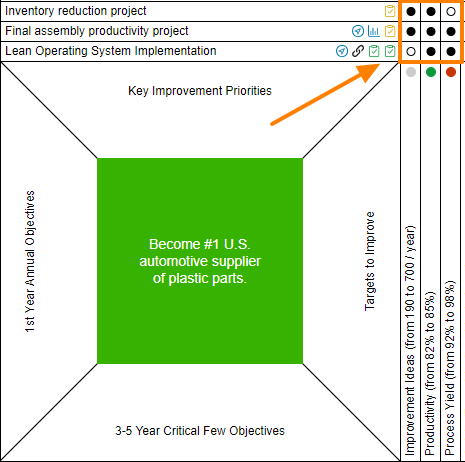
Prioritize your KPIs in X-matrix
Do you need extra KPI visualization for your key projects?
Now you can differentiate that linkage. Mark a primary connection with a full dot & use an empty dot for the secondary relation.
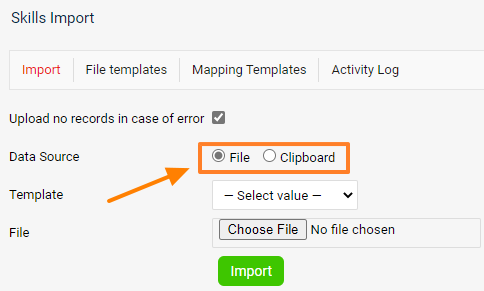
Import your Skills
Would you like to import skills into TeamGuru?
Simply copy+paste your skills using a clipboard or upload your CSV file through the file template.
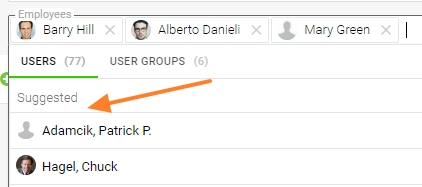
Top-listed frequent employees
A time-saving feature is now available in your Skill Matrix!
Just pick from your personalized list.
Are you ready to give any of these enhancements a try?