Metrics Made Even Smarter
Kate Apking · Aug 11, 2020
Are your metrics’ definitions clear and accessible to your users? TeamGuru metrics let you... Read more
 Kate Apking · Oct 5, 2020

Have you have been swinging and twisting to the sound of music in our 1-minute Report Challenge? If you haven’t yet, don’t miss out. Check how to make a report in 60 seconds.
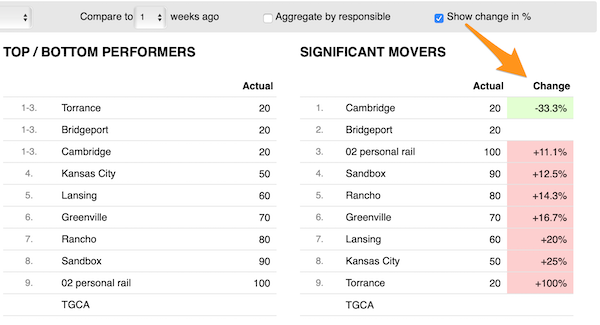
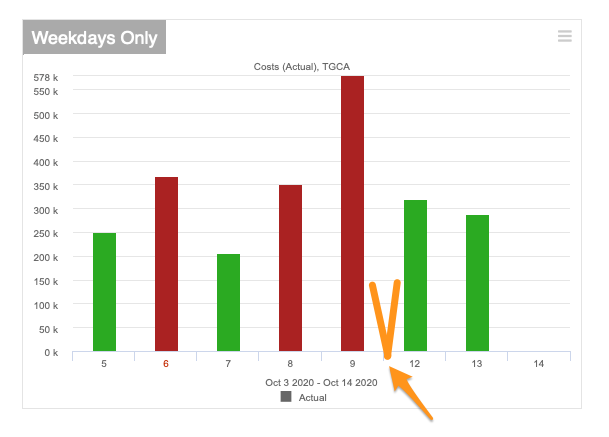
However, today we would like to highlight some of the unique features for your Charts in metric dashboards and reports.

Tired of clicking and time-consuming setup? Avoid all the extra work and watch our video instead.
You might also like...
We keep improving your experience every day.
Do you have an improvement idea? Share it with us.
Do you have friends or colleagues that could benefit from TeamGuru? Let us know.
Are your metrics’ definitions clear and accessible to your users? TeamGuru metrics let you... Read more
Can you prepare your project report within a minute? If you think that we are bluffing, get your stopwatch ready... Read more
Would you like to get a simple overview of all your subprojects in ONE place? Take your idea one step further and line up your subprojects automatically based on... Read more