Are you staying on top of your project timeline?
It is time to bring clarity to your project and get your schedule in order with a clear and precise Gantt chart. You can display and evaluate your dependency relationships and switch to different time spans. Illustrate your project schedule in daily, weekly, or monthly view to dispense informed decisions.
The vertical bar informs about your project progression and current schedule status, while the horizontal line represents your planned work intervals.
Action bar shade reveals the status of the individual action, so you know at a first glance whether the work has already started, is close to the finish line, or is simply past its target. You can swiftly identify your overdue actions and act on them. Watch out for red!
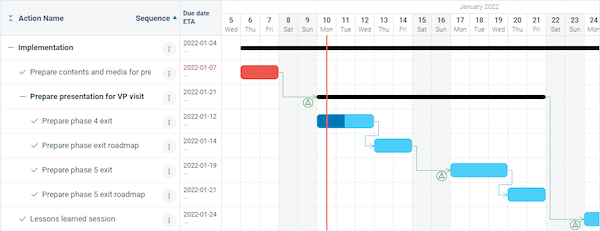
Your adaptable Gantt chart timeline will help you to keep track of all your tasks and reach your goals according to your plan.
Are your project charts dull and need to be sharpened?
You Might Also Like...
Oh, did they @mention ME?
EASIEST Project Metrics You've Ever Seen
Drive Action Track FASTER Than Lewis Hamilton
The TeamGuru Way
We keep improving your experience every day.
Do you have an improvement idea? Share it with us.
Do you have friends or colleagues that could benefit from TeamGuru? Let us know.