Have you have been swinging and twisting to the sound of music in our 1-minute Report Challenge? If you haven’t yet, don’t miss out. Check how to make a report in 60 seconds.
However, today we would like to highlight some of the unique features for your Charts in metric dashboards and reports.
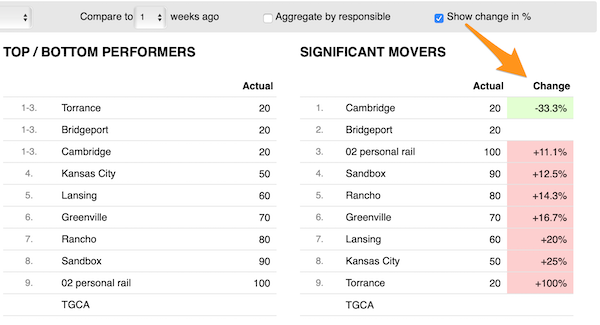
- Do you monitor your Top/Bottom performers and Significant movers? Display progress for your significant movers, not only by absolute values, but also as a PERCENTAGE CHANGE. This option is available in dashboard's statistics and in your report's performance widget.
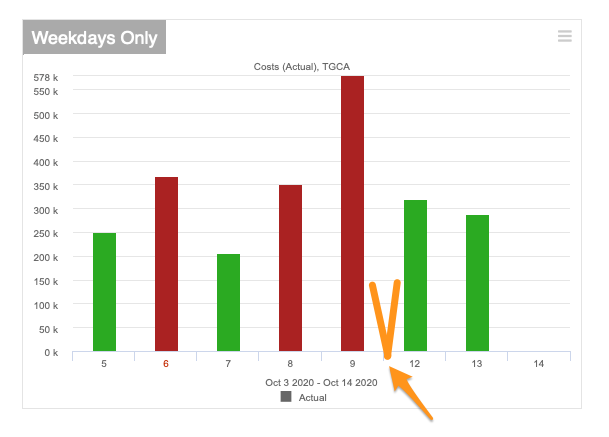
- Do you report your data weekly from Monday to Friday, weekends excluded? Great news! You will now be able to eliminate the redundant data gap in your charts.
- Do your reports include many slides with the same layout BUT with data for different organization units? We made data entity's selection easier and automated.

Tired of clicking and time-consuming setup? Avoid all the extra work and watch our video instead.
You might also like...
Fully Automated Reports
Project Report - Your 1-Minute Challenge
Your Off-the-Charts Statistics
The TeamGuru Way
We keep improving your experience every day.
Do you have an improvement idea? Share it with us.
Do you have friends or colleagues that could benefit from TeamGuru? Let us know.