Do you collect your KPIs for objects with multi-level structures? Many layers to fold or unpeel...
Then you know that it can be a very hard task to keep your metric dashboard's view simple. Too many key performance indicators for too many objects can become messy and not sustainable for getting a clear picture.
How can you work with your data more efficiently?
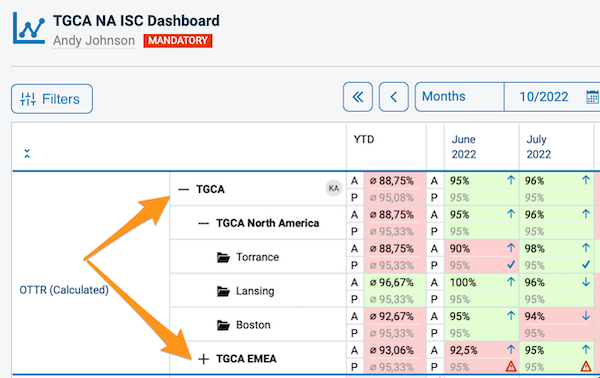
Based on our client's feedback and their needs, we've launched a new feature for you to MUST TRY. TeamGuru enables you to display the objects on your report in a resemblance to a tree structure hierarchy. This enhancement will help you to collapse or expand individual sections for a detailed or consolidated view.
Large reports will become more transparent with an option to drill down to lower levels. You can present your leadership with the most important data and at the same time be ready to provide necessary details.
How do you organize your rollups and groupings?
You Might Also Like...
KEY IN*dicators in Your Dashboard
LIVESTREAM Business KPIs to Your Report
Projects + Dashboard = LOVE
The TeamGuru Way
We keep improving your experience every day.
Do you have an improvement idea? Share it with us.
Do you have friends or colleagues that could benefit from TeamGuru? Let us know.