TeamGuru Release #1000
Pavel Humlíček · Dec 8, 2017
Today we are celebrating the release number 1000. Read more
 Pavel Humlíček · Jan 25, 2018
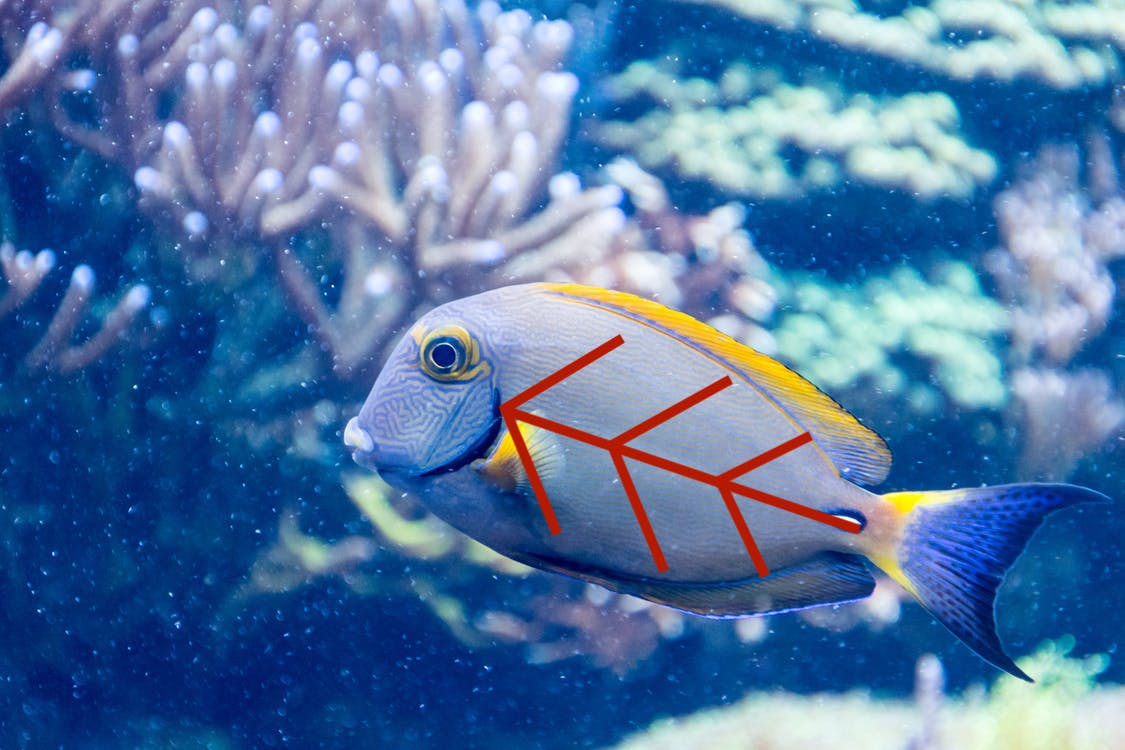
There are different tools that can be used when trying to find out the real root-cause of a problem. One of the very effective ones is called a Fishbone Diagram (Also known as: Cause–and–Effect Diagram, Ishikawa Diagram or 6M Analysis).
Using the diagram you can quickly identify the problem causes and group them into major categories to identify / classify these sources of abnormalities.
And herewith the good news!
We have incorporated the Fishbone analysis directly into TeamGuru’s RCCA module to your full advantage.

Man
Machine
Method
Material
Measurement
Mother Nature
That's it. Now you have even more analytical tools (available right in TeamGuru) that can be used when fixing a problem.
"We work hard to provide an extraordinary leadership management tool to our clients; therefore, we never stop learning, growing and changing in efforts to make our service even greater.”
- Pavel Humlíček, TeamGuru CEO
Today we are celebrating the release number 1000. Read more
Are you in a hurry and don't have time to log in and review your metrics dashboard? Read more
TeamGuru leadership reports are great. You don't have to cut and paste information from older reports or other sources to generate your new monthly update. All it takes is just one click. However, now it all got even better. Read more